West Indian vs Haitian 4 or more Vehicles in Household
COMPARE
West Indian
Haitian
4 or more Vehicles in Household
4 or more Vehicles in Household Comparison
West Indians
Haitians
4.2%
4 OR MORE VEHICLES IN HOUSEHOLD
0.0/ 100
METRIC RATING
331st/ 347
METRIC RANK
4.6%
4 OR MORE VEHICLES IN HOUSEHOLD
0.0/ 100
METRIC RATING
319th/ 347
METRIC RANK
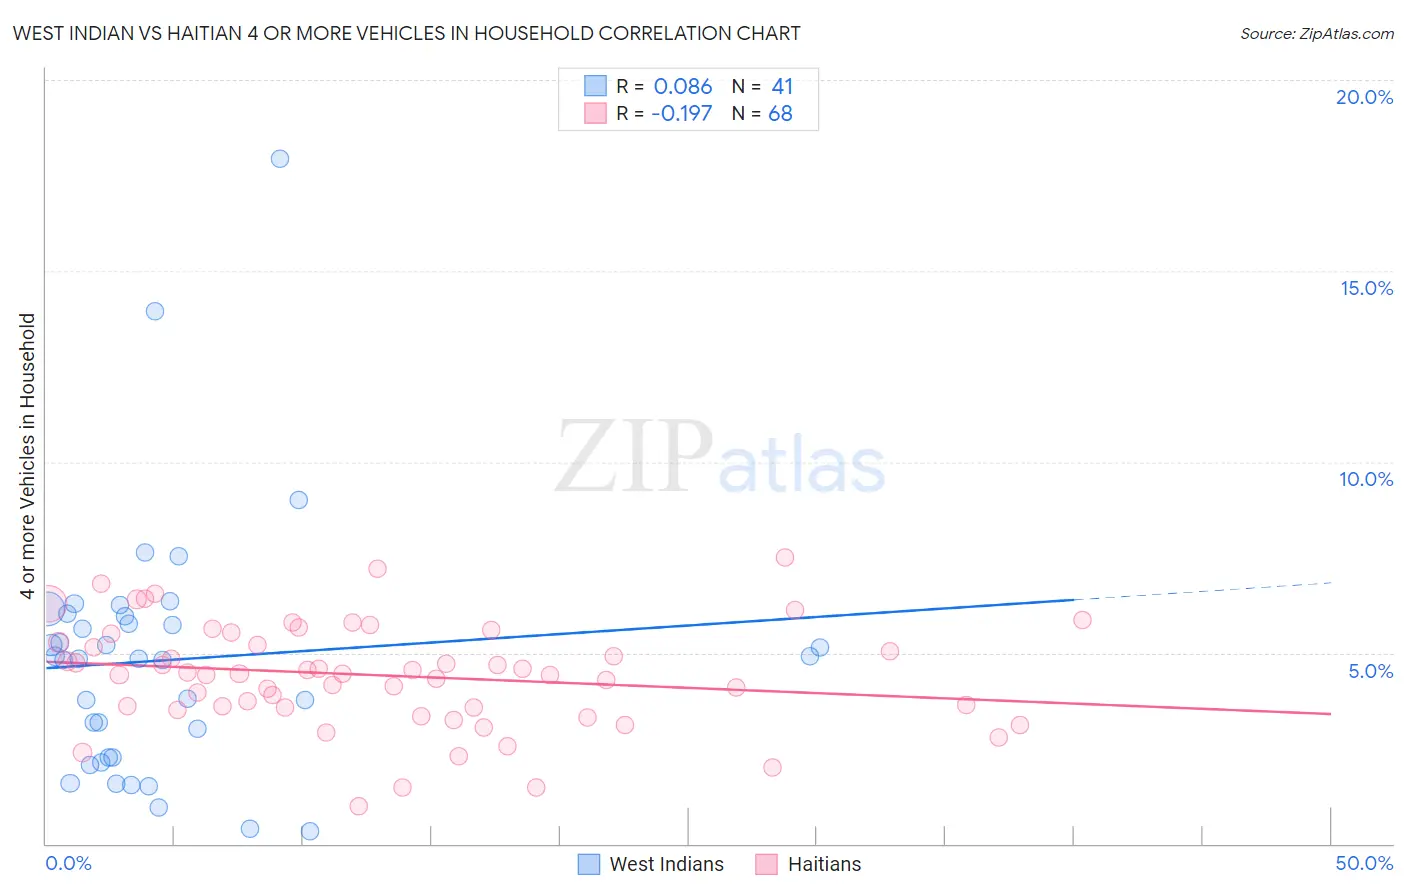
West Indian vs Haitian 4 or more Vehicles in Household Correlation Chart
The statistical analysis conducted on geographies consisting of 252,612,993 people shows a slight positive correlation between the proportion of West Indians and percentage of households with 4 or more vehicles available in the United States with a correlation coefficient (R) of 0.086 and weighted average of 4.2%. Similarly, the statistical analysis conducted on geographies consisting of 286,216,427 people shows a poor negative correlation between the proportion of Haitians and percentage of households with 4 or more vehicles available in the United States with a correlation coefficient (R) of -0.197 and weighted average of 4.6%, a difference of 9.0%.
4 or more Vehicles in Household Correlation Summary
| Measurement | West Indian | Haitian |
| Minimum | 0.34% | 0.97% |
| Maximum | 17.9% | 7.5% |
| Range | 17.6% | 6.5% |
| Mean | 4.8% | 4.4% |
| Median | 4.9% | 4.4% |
| Interquartile 25% (IQ1) | 2.3% | 3.6% |
| Interquartile 75% (IQ3) | 6.0% | 5.4% |
| Interquartile Range (IQR) | 3.7% | 1.8% |
| Standard Deviation (Sample) | 3.3% | 1.4% |
| Standard Deviation (Population) | 3.3% | 1.4% |
Demographics Similar to West Indians and Haitians by 4 or more Vehicles in Household
In terms of 4 or more vehicles in household, the demographic groups most similar to West Indians are Immigrants from Ecuador (4.2%, a difference of 0.26%), Immigrants from Senegal (4.2%, a difference of 0.46%), Trinidadian and Tobagonian (4.3%, a difference of 0.73%), Immigrants from Dominica (4.2%, a difference of 0.90%), and Senegalese (4.3%, a difference of 2.3%). Similarly, the demographic groups most similar to Haitians are Jamaican (4.6%, a difference of 0.65%), U.S. Virgin Islander (4.6%, a difference of 0.89%), Immigrants from Haiti (4.5%, a difference of 2.3%), Puerto Rican (4.7%, a difference of 2.6%), and Immigrants from Belarus (4.7%, a difference of 3.0%).
| Demographics | Rating | Rank | 4 or more Vehicles in Household |
| Immigrants | Belarus | 0.0 /100 | #315 | Tragic 4.7% |
| Puerto Ricans | 0.0 /100 | #316 | Tragic 4.7% |
| U.S. Virgin Islanders | 0.0 /100 | #317 | Tragic 4.6% |
| Jamaicans | 0.0 /100 | #318 | Tragic 4.6% |
| Haitians | 0.0 /100 | #319 | Tragic 4.6% |
| Immigrants | Haiti | 0.0 /100 | #320 | Tragic 4.5% |
| Ecuadorians | 0.0 /100 | #321 | Tragic 4.5% |
| Immigrants | Yemen | 0.0 /100 | #322 | Tragic 4.5% |
| Immigrants | Caribbean | 0.0 /100 | #323 | Tragic 4.4% |
| Soviet Union | 0.0 /100 | #324 | Tragic 4.4% |
| Immigrants | Jamaica | 0.0 /100 | #325 | Tragic 4.4% |
| Cape Verdeans | 0.0 /100 | #326 | Tragic 4.4% |
| Senegalese | 0.0 /100 | #327 | Tragic 4.3% |
| Trinidadians and Tobagonians | 0.0 /100 | #328 | Tragic 4.3% |
| Immigrants | Senegal | 0.0 /100 | #329 | Tragic 4.2% |
| Immigrants | Ecuador | 0.0 /100 | #330 | Tragic 4.2% |
| West Indians | 0.0 /100 | #331 | Tragic 4.2% |
| Immigrants | Dominica | 0.0 /100 | #332 | Tragic 4.2% |
| Immigrants | Albania | 0.0 /100 | #333 | Tragic 4.1% |
| Immigrants | Trinidad and Tobago | 0.0 /100 | #334 | Tragic 4.1% |
| Barbadians | 0.0 /100 | #335 | Tragic 3.9% |