Immigrants from Ukraine vs Immigrants from Nepal 4 or more Vehicles in Household
COMPARE
Immigrants from Ukraine
Immigrants from Nepal
4 or more Vehicles in Household
4 or more Vehicles in Household Comparison
Immigrants from Ukraine
Immigrants from Nepal
5.6%
4 OR MORE VEHICLES IN HOUSEHOLD
0.9/ 100
METRIC RATING
267th/ 347
METRIC RANK
5.6%
4 OR MORE VEHICLES IN HOUSEHOLD
0.9/ 100
METRIC RATING
266th/ 347
METRIC RANK
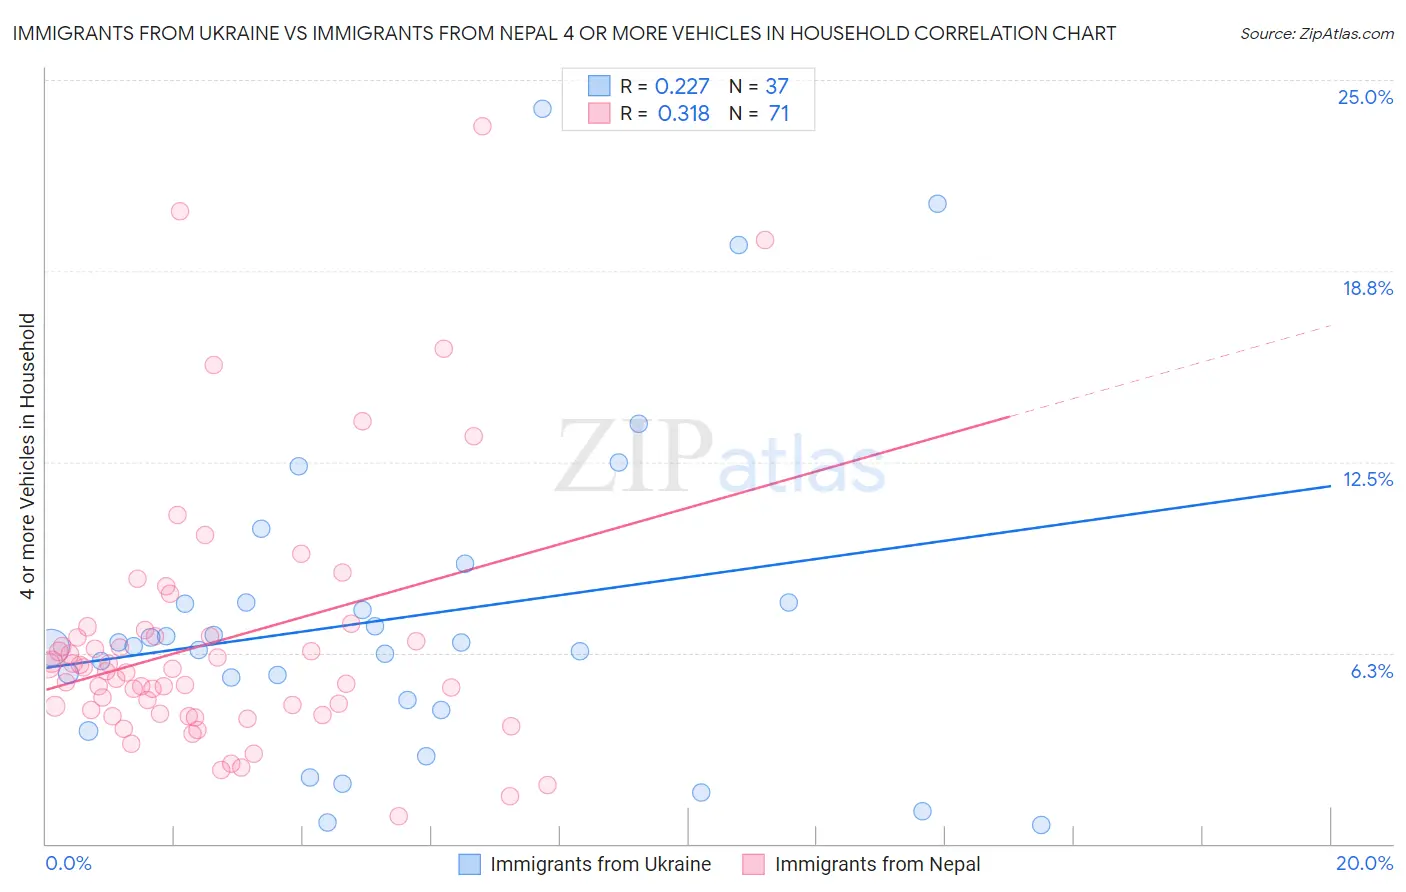
Immigrants from Ukraine vs Immigrants from Nepal 4 or more Vehicles in Household Correlation Chart
The statistical analysis conducted on geographies consisting of 288,490,900 people shows a weak positive correlation between the proportion of Immigrants from Ukraine and percentage of households with 4 or more vehicles available in the United States with a correlation coefficient (R) of 0.227 and weighted average of 5.6%. Similarly, the statistical analysis conducted on geographies consisting of 186,146,815 people shows a mild positive correlation between the proportion of Immigrants from Nepal and percentage of households with 4 or more vehicles available in the United States with a correlation coefficient (R) of 0.318 and weighted average of 5.6%, a difference of 0.080%.
4 or more Vehicles in Household Correlation Summary
| Measurement | Immigrants from Ukraine | Immigrants from Nepal |
| Minimum | 0.61% | 0.91% |
| Maximum | 24.1% | 23.5% |
| Range | 23.5% | 22.6% |
| Mean | 7.4% | 6.6% |
| Median | 6.4% | 5.7% |
| Interquartile 25% (IQ1) | 4.5% | 4.2% |
| Interquartile 75% (IQ3) | 7.9% | 6.8% |
| Interquartile Range (IQR) | 3.4% | 2.6% |
| Standard Deviation (Sample) | 5.3% | 4.2% |
| Standard Deviation (Population) | 5.2% | 4.2% |
Demographics Similar to Immigrants from Ukraine and Immigrants from Nepal by 4 or more Vehicles in Household
In terms of 4 or more vehicles in household, the demographic groups most similar to Immigrants from Ukraine are South American (5.6%, a difference of 0.11%), Immigrants from Africa (5.6%, a difference of 0.32%), Colombian (5.5%, a difference of 0.43%), Carpatho Rusyn (5.5%, a difference of 0.59%), and Okinawan (5.5%, a difference of 0.79%). Similarly, the demographic groups most similar to Immigrants from Nepal are South American (5.6%, a difference of 0.020%), Immigrants from Africa (5.6%, a difference of 0.24%), Colombian (5.5%, a difference of 0.51%), Carpatho Rusyn (5.5%, a difference of 0.67%), and Immigrants from Saudi Arabia (5.6%, a difference of 0.78%).
| Demographics | Rating | Rank | 4 or more Vehicles in Household |
| Immigrants | Turkey | 1.5 /100 | #256 | Tragic 5.7% |
| Immigrants | Northern Africa | 1.4 /100 | #257 | Tragic 5.6% |
| Immigrants | Lithuania | 1.4 /100 | #258 | Tragic 5.6% |
| Immigrants | France | 1.3 /100 | #259 | Tragic 5.6% |
| Uruguayans | 1.3 /100 | #260 | Tragic 5.6% |
| Sudanese | 1.2 /100 | #261 | Tragic 5.6% |
| Bermudans | 1.2 /100 | #262 | Tragic 5.6% |
| Immigrants | Saudi Arabia | 1.1 /100 | #263 | Tragic 5.6% |
| Immigrants | Africa | 1.0 /100 | #264 | Tragic 5.6% |
| South Americans | 0.9 /100 | #265 | Tragic 5.6% |
| Immigrants | Nepal | 0.9 /100 | #266 | Tragic 5.6% |
| Immigrants | Ukraine | 0.9 /100 | #267 | Tragic 5.6% |
| Colombians | 0.7 /100 | #268 | Tragic 5.5% |
| Carpatho Rusyns | 0.7 /100 | #269 | Tragic 5.5% |
| Okinawans | 0.6 /100 | #270 | Tragic 5.5% |
| Immigrants | Sudan | 0.6 /100 | #271 | Tragic 5.5% |
| Immigrants | Kazakhstan | 0.6 /100 | #272 | Tragic 5.5% |
| Macedonians | 0.6 /100 | #273 | Tragic 5.5% |
| Blacks/African Americans | 0.6 /100 | #274 | Tragic 5.5% |
| Cambodians | 0.5 /100 | #275 | Tragic 5.5% |
| Immigrants | Latvia | 0.5 /100 | #276 | Tragic 5.5% |