Immigrants from Panama vs Trinidadian and Tobagonian 4 or more Vehicles in Household
COMPARE
Immigrants from Panama
Trinidadian and Tobagonian
4 or more Vehicles in Household
4 or more Vehicles in Household Comparison
Immigrants from Panama
Trinidadians and Tobagonians
5.7%
4 OR MORE VEHICLES IN HOUSEHOLD
1.5/ 100
METRIC RATING
254th/ 347
METRIC RANK
4.3%
4 OR MORE VEHICLES IN HOUSEHOLD
0.0/ 100
METRIC RATING
328th/ 347
METRIC RANK
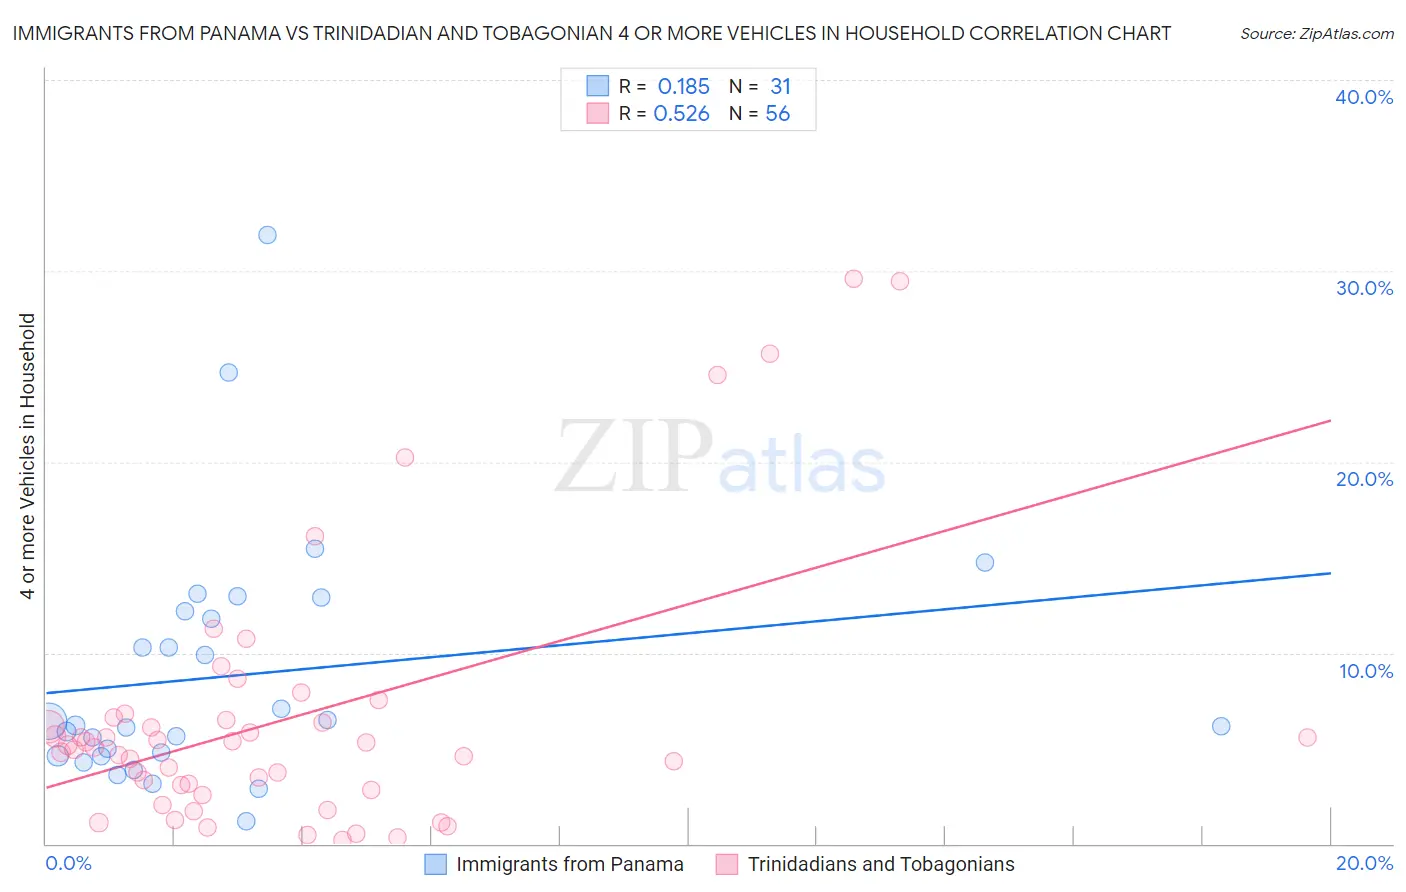
Immigrants from Panama vs Trinidadian and Tobagonian 4 or more Vehicles in Household Correlation Chart
The statistical analysis conducted on geographies consisting of 220,402,511 people shows a poor positive correlation between the proportion of Immigrants from Panama and percentage of households with 4 or more vehicles available in the United States with a correlation coefficient (R) of 0.185 and weighted average of 5.7%. Similarly, the statistical analysis conducted on geographies consisting of 218,579,847 people shows a substantial positive correlation between the proportion of Trinidadians and Tobagonians and percentage of households with 4 or more vehicles available in the United States with a correlation coefficient (R) of 0.526 and weighted average of 4.3%, a difference of 33.0%.
4 or more Vehicles in Household Correlation Summary
| Measurement | Immigrants from Panama | Trinidadian and Tobagonian |
| Minimum | 1.2% | 0.23% |
| Maximum | 31.9% | 29.6% |
| Range | 30.7% | 29.4% |
| Mean | 8.8% | 6.6% |
| Median | 6.2% | 5.1% |
| Interquartile 25% (IQ1) | 4.6% | 3.0% |
| Interquartile 75% (IQ3) | 12.2% | 6.6% |
| Interquartile Range (IQR) | 7.6% | 3.6% |
| Standard Deviation (Sample) | 6.5% | 6.8% |
| Standard Deviation (Population) | 6.4% | 6.8% |
Similar Demographics by 4 or more Vehicles in Household
Demographics Similar to Immigrants from Panama by 4 or more Vehicles in Household
In terms of 4 or more vehicles in household, the demographic groups most similar to Immigrants from Panama are Yup'ik (5.7%, a difference of 0.090%), Immigrants from Turkey (5.7%, a difference of 0.12%), Immigrants from Cuba (5.7%, a difference of 0.14%), Immigrants from Northern Africa (5.6%, a difference of 0.20%), and Immigrants from Lithuania (5.6%, a difference of 0.34%).
| Demographics | Rating | Rank | 4 or more Vehicles in Household |
| Immigrants | Ethiopia | 2.4 /100 | #247 | Tragic 5.7% |
| Immigrants | Eastern Africa | 2.4 /100 | #248 | Tragic 5.7% |
| Immigrants | Southern Europe | 2.3 /100 | #249 | Tragic 5.7% |
| Immigrants | Europe | 2.3 /100 | #250 | Tragic 5.7% |
| Ugandans | 2.2 /100 | #251 | Tragic 5.7% |
| Sub-Saharan Africans | 2.1 /100 | #252 | Tragic 5.7% |
| Immigrants | Cuba | 1.6 /100 | #253 | Tragic 5.7% |
| Immigrants | Panama | 1.5 /100 | #254 | Tragic 5.7% |
| Yup'ik | 1.5 /100 | #255 | Tragic 5.7% |
| Immigrants | Turkey | 1.5 /100 | #256 | Tragic 5.7% |
| Immigrants | Northern Africa | 1.4 /100 | #257 | Tragic 5.6% |
| Immigrants | Lithuania | 1.4 /100 | #258 | Tragic 5.6% |
| Immigrants | France | 1.3 /100 | #259 | Tragic 5.6% |
| Uruguayans | 1.3 /100 | #260 | Tragic 5.6% |
| Sudanese | 1.2 /100 | #261 | Tragic 5.6% |
Demographics Similar to Trinidadians and Tobagonians by 4 or more Vehicles in Household
In terms of 4 or more vehicles in household, the demographic groups most similar to Trinidadians and Tobagonians are Immigrants from Senegal (4.2%, a difference of 0.27%), Immigrants from Ecuador (4.2%, a difference of 0.47%), West Indian (4.2%, a difference of 0.73%), Senegalese (4.3%, a difference of 1.6%), and Immigrants from Dominica (4.2%, a difference of 1.6%).
| Demographics | Rating | Rank | 4 or more Vehicles in Household |
| Ecuadorians | 0.0 /100 | #321 | Tragic 4.5% |
| Immigrants | Yemen | 0.0 /100 | #322 | Tragic 4.5% |
| Immigrants | Caribbean | 0.0 /100 | #323 | Tragic 4.4% |
| Soviet Union | 0.0 /100 | #324 | Tragic 4.4% |
| Immigrants | Jamaica | 0.0 /100 | #325 | Tragic 4.4% |
| Cape Verdeans | 0.0 /100 | #326 | Tragic 4.4% |
| Senegalese | 0.0 /100 | #327 | Tragic 4.3% |
| Trinidadians and Tobagonians | 0.0 /100 | #328 | Tragic 4.3% |
| Immigrants | Senegal | 0.0 /100 | #329 | Tragic 4.2% |
| Immigrants | Ecuador | 0.0 /100 | #330 | Tragic 4.2% |
| West Indians | 0.0 /100 | #331 | Tragic 4.2% |
| Immigrants | Dominica | 0.0 /100 | #332 | Tragic 4.2% |
| Immigrants | Albania | 0.0 /100 | #333 | Tragic 4.1% |
| Immigrants | Trinidad and Tobago | 0.0 /100 | #334 | Tragic 4.1% |
| Barbadians | 0.0 /100 | #335 | Tragic 3.9% |