Immigrants from Panama vs Immigrants from India 4 or more Vehicles in Household
COMPARE
Immigrants from Panama
Immigrants from India
4 or more Vehicles in Household
4 or more Vehicles in Household Comparison
Immigrants from Panama
Immigrants from India
5.7%
4 OR MORE VEHICLES IN HOUSEHOLD
1.5/ 100
METRIC RATING
254th/ 347
METRIC RANK
6.3%
4 OR MORE VEHICLES IN HOUSEHOLD
51.9/ 100
METRIC RATING
171st/ 347
METRIC RANK
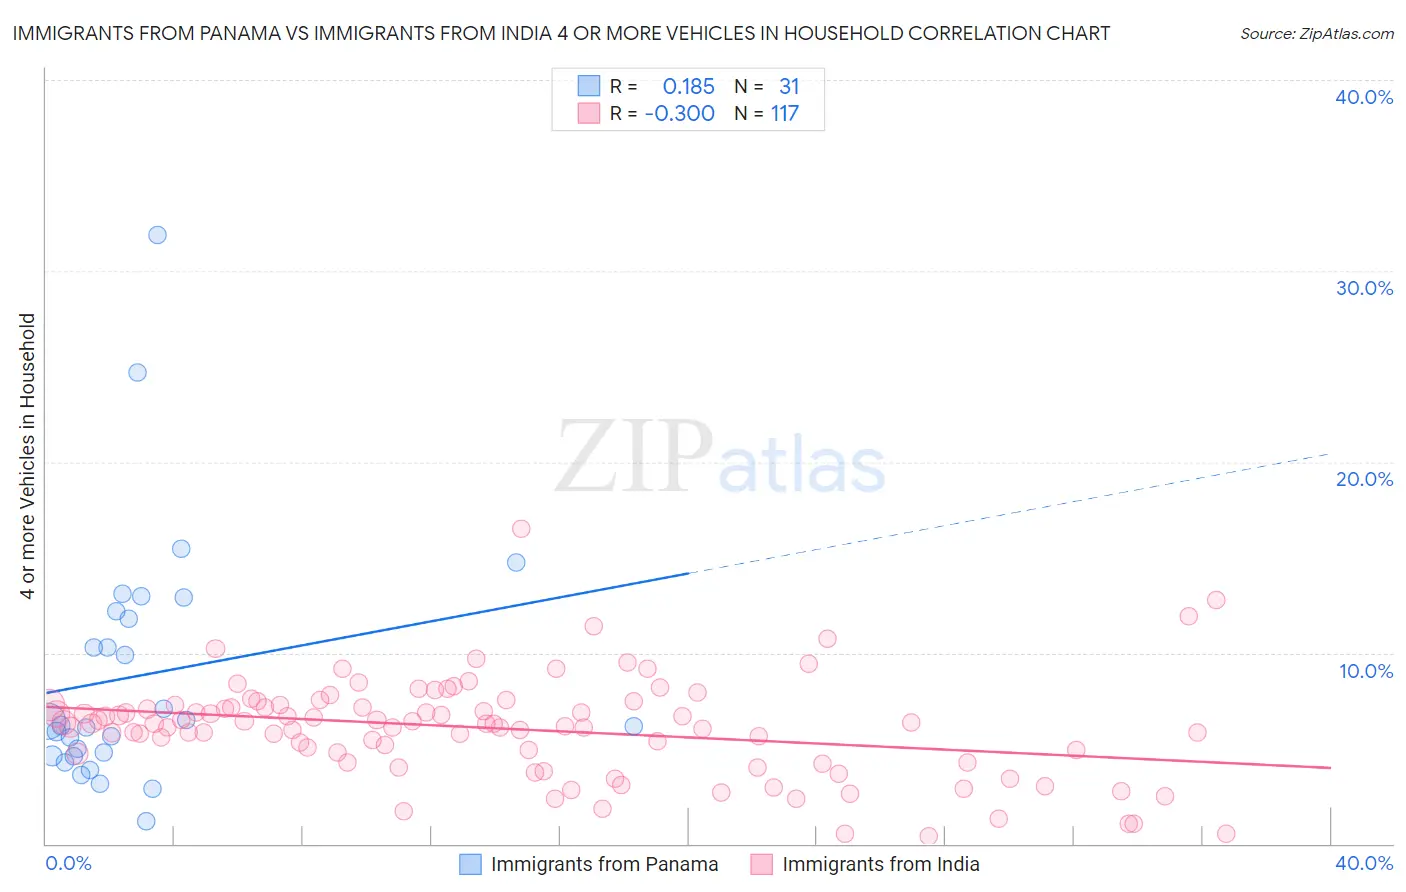
Immigrants from Panama vs Immigrants from India 4 or more Vehicles in Household Correlation Chart
The statistical analysis conducted on geographies consisting of 220,402,511 people shows a poor positive correlation between the proportion of Immigrants from Panama and percentage of households with 4 or more vehicles available in the United States with a correlation coefficient (R) of 0.185 and weighted average of 5.7%. Similarly, the statistical analysis conducted on geographies consisting of 431,878,521 people shows a mild negative correlation between the proportion of Immigrants from India and percentage of households with 4 or more vehicles available in the United States with a correlation coefficient (R) of -0.300 and weighted average of 6.3%, a difference of 12.0%.
4 or more Vehicles in Household Correlation Summary
| Measurement | Immigrants from Panama | Immigrants from India |
| Minimum | 1.2% | 0.38% |
| Maximum | 31.9% | 16.5% |
| Range | 30.7% | 16.1% |
| Mean | 8.8% | 6.0% |
| Median | 6.2% | 6.3% |
| Interquartile 25% (IQ1) | 4.6% | 4.5% |
| Interquartile 75% (IQ3) | 12.2% | 7.2% |
| Interquartile Range (IQR) | 7.6% | 2.8% |
| Standard Deviation (Sample) | 6.5% | 2.6% |
| Standard Deviation (Population) | 6.4% | 2.6% |
Similar Demographics by 4 or more Vehicles in Household
Demographics Similar to Immigrants from Panama by 4 or more Vehicles in Household
In terms of 4 or more vehicles in household, the demographic groups most similar to Immigrants from Panama are Yup'ik (5.7%, a difference of 0.090%), Immigrants from Turkey (5.7%, a difference of 0.12%), Immigrants from Cuba (5.7%, a difference of 0.14%), Immigrants from Northern Africa (5.6%, a difference of 0.20%), and Immigrants from Lithuania (5.6%, a difference of 0.34%).
| Demographics | Rating | Rank | 4 or more Vehicles in Household |
| Immigrants | Ethiopia | 2.4 /100 | #247 | Tragic 5.7% |
| Immigrants | Eastern Africa | 2.4 /100 | #248 | Tragic 5.7% |
| Immigrants | Southern Europe | 2.3 /100 | #249 | Tragic 5.7% |
| Immigrants | Europe | 2.3 /100 | #250 | Tragic 5.7% |
| Ugandans | 2.2 /100 | #251 | Tragic 5.7% |
| Sub-Saharan Africans | 2.1 /100 | #252 | Tragic 5.7% |
| Immigrants | Cuba | 1.6 /100 | #253 | Tragic 5.7% |
| Immigrants | Panama | 1.5 /100 | #254 | Tragic 5.7% |
| Yup'ik | 1.5 /100 | #255 | Tragic 5.7% |
| Immigrants | Turkey | 1.5 /100 | #256 | Tragic 5.7% |
| Immigrants | Northern Africa | 1.4 /100 | #257 | Tragic 5.6% |
| Immigrants | Lithuania | 1.4 /100 | #258 | Tragic 5.6% |
| Immigrants | France | 1.3 /100 | #259 | Tragic 5.6% |
| Uruguayans | 1.3 /100 | #260 | Tragic 5.6% |
| Sudanese | 1.2 /100 | #261 | Tragic 5.6% |
Demographics Similar to Immigrants from India by 4 or more Vehicles in Household
In terms of 4 or more vehicles in household, the demographic groups most similar to Immigrants from India are Immigrants from Lebanon (6.3%, a difference of 0.020%), Immigrants from Syria (6.3%, a difference of 0.080%), Slovene (6.3%, a difference of 0.080%), Lithuanian (6.3%, a difference of 0.20%), and Estonian (6.4%, a difference of 0.32%).
| Demographics | Rating | Rank | 4 or more Vehicles in Household |
| Hungarians | 61.1 /100 | #164 | Good 6.4% |
| Immigrants | Peru | 59.8 /100 | #165 | Average 6.4% |
| Immigrants | Denmark | 57.8 /100 | #166 | Average 6.4% |
| Poles | 56.9 /100 | #167 | Average 6.4% |
| Lebanese | 55.8 /100 | #168 | Average 6.4% |
| Estonians | 55.1 /100 | #169 | Average 6.4% |
| Immigrants | Syria | 52.8 /100 | #170 | Average 6.3% |
| Immigrants | India | 51.9 /100 | #171 | Average 6.3% |
| Immigrants | Lebanon | 51.7 /100 | #172 | Average 6.3% |
| Slovenes | 51.1 /100 | #173 | Average 6.3% |
| Lithuanians | 50.0 /100 | #174 | Average 6.3% |
| Immigrants | Western Europe | 48.8 /100 | #175 | Average 6.3% |
| Ukrainians | 47.6 /100 | #176 | Average 6.3% |
| Slovaks | 46.9 /100 | #177 | Average 6.3% |
| Belizeans | 44.5 /100 | #178 | Average 6.3% |