Immigrants from Panama vs Immigrants from Scotland 4 or more Vehicles in Household
COMPARE
Immigrants from Panama
Immigrants from Scotland
4 or more Vehicles in Household
4 or more Vehicles in Household Comparison
Immigrants from Panama
Immigrants from Scotland
5.7%
4 OR MORE VEHICLES IN HOUSEHOLD
1.5/ 100
METRIC RATING
254th/ 347
METRIC RANK
6.7%
4 OR MORE VEHICLES IN HOUSEHOLD
89.0/ 100
METRIC RATING
130th/ 347
METRIC RANK
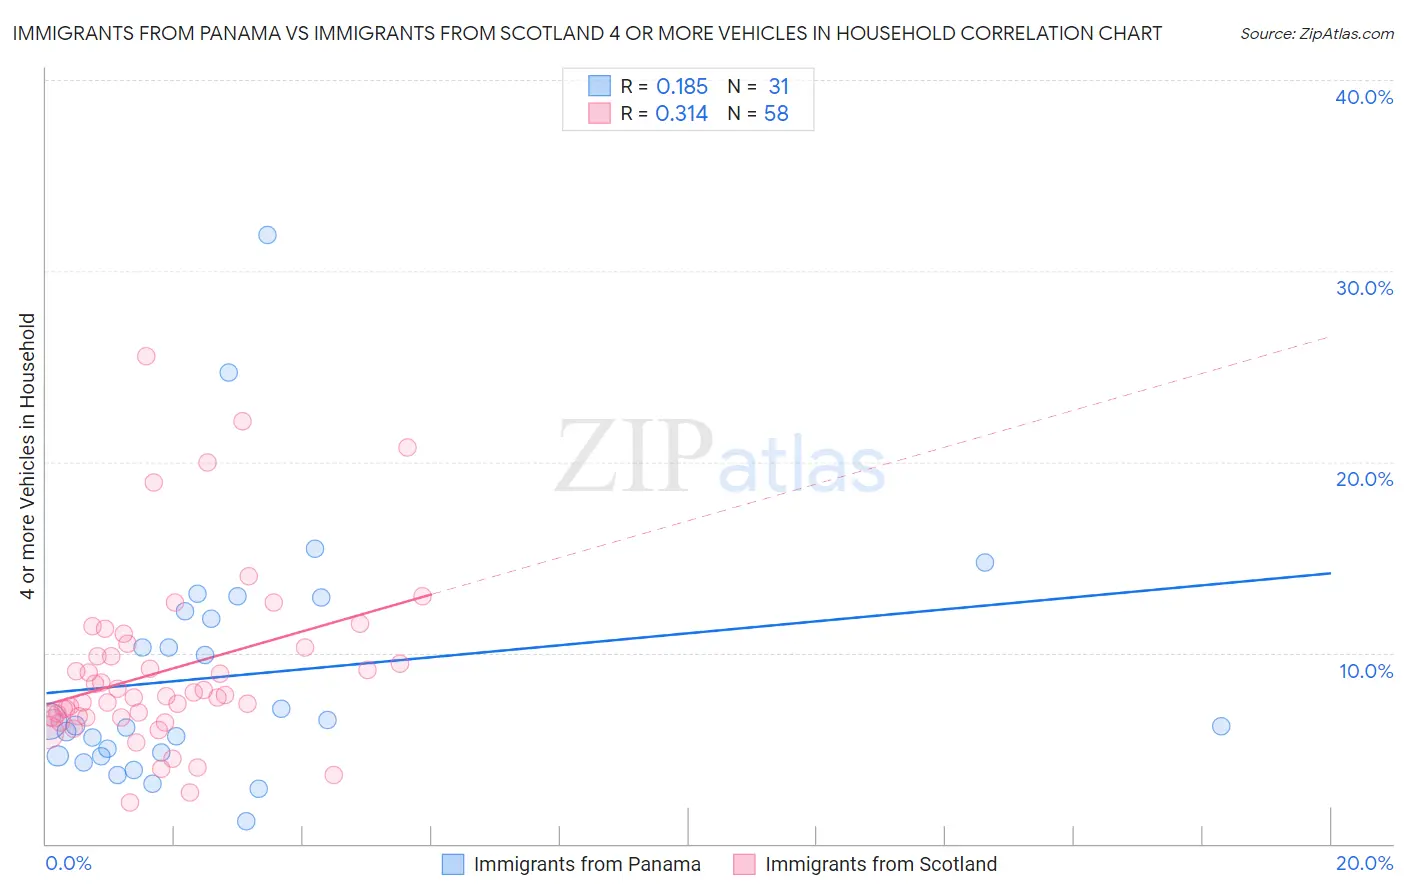
Immigrants from Panama vs Immigrants from Scotland 4 or more Vehicles in Household Correlation Chart
The statistical analysis conducted on geographies consisting of 220,402,511 people shows a poor positive correlation between the proportion of Immigrants from Panama and percentage of households with 4 or more vehicles available in the United States with a correlation coefficient (R) of 0.185 and weighted average of 5.7%. Similarly, the statistical analysis conducted on geographies consisting of 195,944,485 people shows a mild positive correlation between the proportion of Immigrants from Scotland and percentage of households with 4 or more vehicles available in the United States with a correlation coefficient (R) of 0.314 and weighted average of 6.7%, a difference of 17.7%.
4 or more Vehicles in Household Correlation Summary
| Measurement | Immigrants from Panama | Immigrants from Scotland |
| Minimum | 1.2% | 2.2% |
| Maximum | 31.9% | 25.6% |
| Range | 30.7% | 23.4% |
| Mean | 8.8% | 9.1% |
| Median | 6.2% | 7.7% |
| Interquartile 25% (IQ1) | 4.6% | 6.6% |
| Interquartile 75% (IQ3) | 12.2% | 10.3% |
| Interquartile Range (IQR) | 7.6% | 3.6% |
| Standard Deviation (Sample) | 6.5% | 4.6% |
| Standard Deviation (Population) | 6.4% | 4.6% |
Similar Demographics by 4 or more Vehicles in Household
Demographics Similar to Immigrants from Panama by 4 or more Vehicles in Household
In terms of 4 or more vehicles in household, the demographic groups most similar to Immigrants from Panama are Yup'ik (5.7%, a difference of 0.090%), Immigrants from Turkey (5.7%, a difference of 0.12%), Immigrants from Cuba (5.7%, a difference of 0.14%), Immigrants from Northern Africa (5.6%, a difference of 0.20%), and Immigrants from Lithuania (5.6%, a difference of 0.34%).
| Demographics | Rating | Rank | 4 or more Vehicles in Household |
| Immigrants | Ethiopia | 2.4 /100 | #247 | Tragic 5.7% |
| Immigrants | Eastern Africa | 2.4 /100 | #248 | Tragic 5.7% |
| Immigrants | Southern Europe | 2.3 /100 | #249 | Tragic 5.7% |
| Immigrants | Europe | 2.3 /100 | #250 | Tragic 5.7% |
| Ugandans | 2.2 /100 | #251 | Tragic 5.7% |
| Sub-Saharan Africans | 2.1 /100 | #252 | Tragic 5.7% |
| Immigrants | Cuba | 1.6 /100 | #253 | Tragic 5.7% |
| Immigrants | Panama | 1.5 /100 | #254 | Tragic 5.7% |
| Yup'ik | 1.5 /100 | #255 | Tragic 5.7% |
| Immigrants | Turkey | 1.5 /100 | #256 | Tragic 5.7% |
| Immigrants | Northern Africa | 1.4 /100 | #257 | Tragic 5.6% |
| Immigrants | Lithuania | 1.4 /100 | #258 | Tragic 5.6% |
| Immigrants | France | 1.3 /100 | #259 | Tragic 5.6% |
| Uruguayans | 1.3 /100 | #260 | Tragic 5.6% |
| Sudanese | 1.2 /100 | #261 | Tragic 5.6% |
Demographics Similar to Immigrants from Scotland by 4 or more Vehicles in Household
In terms of 4 or more vehicles in household, the demographic groups most similar to Immigrants from Scotland are Maltese (6.7%, a difference of 0.15%), Immigrants from Netherlands (6.6%, a difference of 0.29%), Armenian (6.6%, a difference of 0.48%), Ottawa (6.6%, a difference of 0.50%), and Tohono O'odham (6.6%, a difference of 0.53%).
| Demographics | Rating | Rank | 4 or more Vehicles in Household |
| Immigrants | Immigrants | 94.6 /100 | #123 | Exceptional 6.8% |
| Immigrants | Asia | 94.4 /100 | #124 | Exceptional 6.8% |
| Austrians | 94.1 /100 | #125 | Exceptional 6.8% |
| Belgians | 94.1 /100 | #126 | Exceptional 6.8% |
| Immigrants | Korea | 93.8 /100 | #127 | Exceptional 6.8% |
| Immigrants | Bolivia | 92.5 /100 | #128 | Exceptional 6.7% |
| Immigrants | England | 92.0 /100 | #129 | Exceptional 6.7% |
| Immigrants | Scotland | 89.0 /100 | #130 | Excellent 6.7% |
| Maltese | 88.4 /100 | #131 | Excellent 6.7% |
| Immigrants | Netherlands | 87.8 /100 | #132 | Excellent 6.6% |
| Armenians | 86.9 /100 | #133 | Excellent 6.6% |
| Ottawa | 86.9 /100 | #134 | Excellent 6.6% |
| Tohono O'odham | 86.7 /100 | #135 | Excellent 6.6% |
| Luxembourgers | 86.4 /100 | #136 | Excellent 6.6% |
| French Canadians | 85.4 /100 | #137 | Excellent 6.6% |