Immigrants from Hungary vs Celtic 4 or more Vehicles in Household
COMPARE
Immigrants from Hungary
Celtic
4 or more Vehicles in Household
4 or more Vehicles in Household Comparison
Immigrants from Hungary
Celtics
5.8%
4 OR MORE VEHICLES IN HOUSEHOLD
4.6/ 100
METRIC RATING
235th/ 347
METRIC RANK
7.1%
4 OR MORE VEHICLES IN HOUSEHOLD
99.1/ 100
METRIC RATING
97th/ 347
METRIC RANK
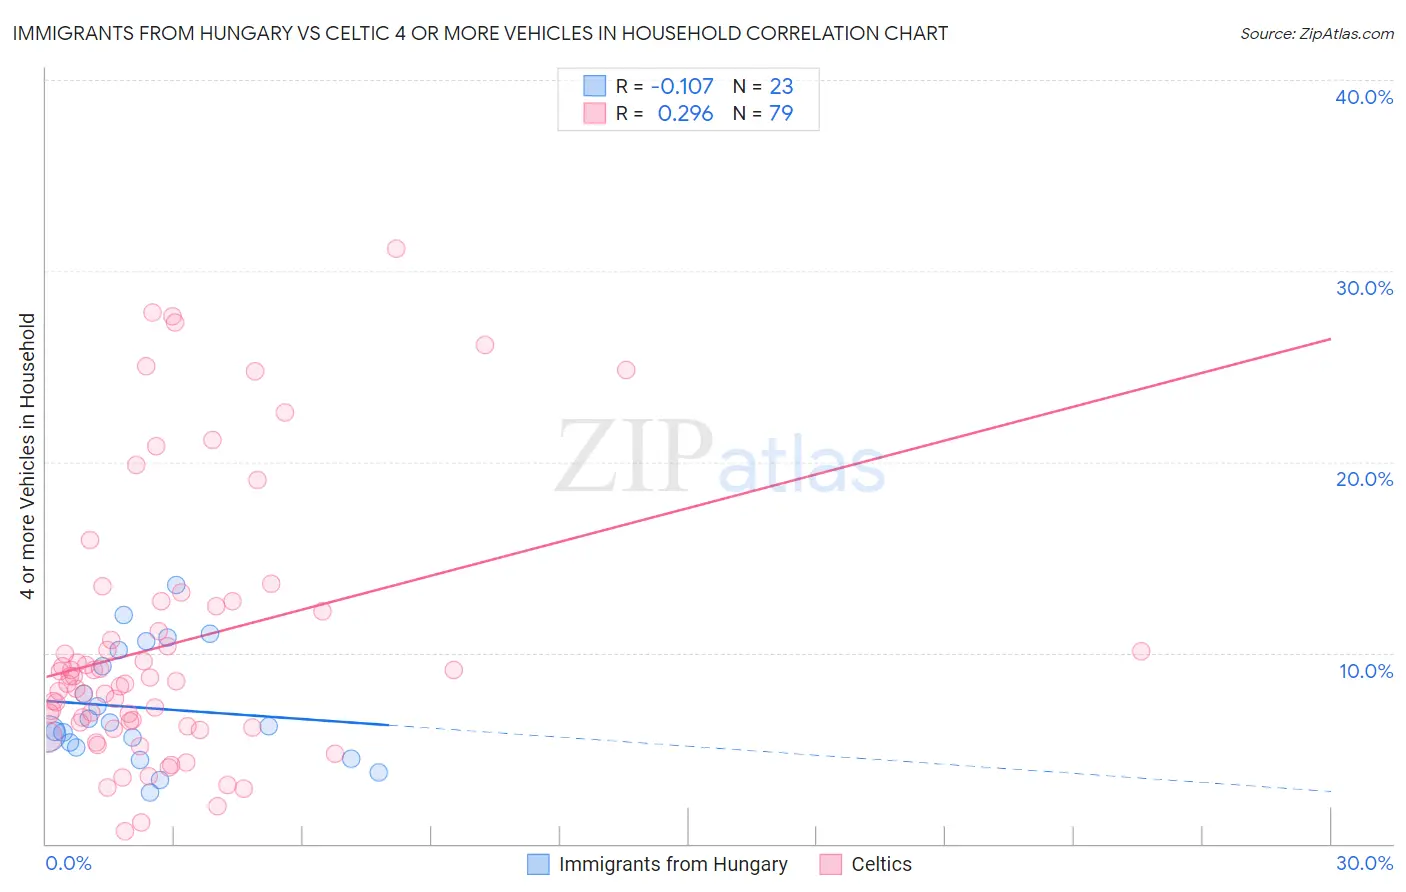
Immigrants from Hungary vs Celtic 4 or more Vehicles in Household Correlation Chart
The statistical analysis conducted on geographies consisting of 194,934,489 people shows a poor negative correlation between the proportion of Immigrants from Hungary and percentage of households with 4 or more vehicles available in the United States with a correlation coefficient (R) of -0.107 and weighted average of 5.8%. Similarly, the statistical analysis conducted on geographies consisting of 168,678,221 people shows a weak positive correlation between the proportion of Celtics and percentage of households with 4 or more vehicles available in the United States with a correlation coefficient (R) of 0.296 and weighted average of 7.1%, a difference of 21.4%.
4 or more Vehicles in Household Correlation Summary
| Measurement | Immigrants from Hungary | Celtic |
| Minimum | 2.7% | 0.62% |
| Maximum | 13.6% | 31.2% |
| Range | 10.9% | 30.6% |
| Mean | 7.1% | 10.5% |
| Median | 6.2% | 8.5% |
| Interquartile 25% (IQ1) | 5.1% | 6.1% |
| Interquartile 75% (IQ3) | 10.2% | 12.5% |
| Interquartile Range (IQR) | 5.1% | 6.3% |
| Standard Deviation (Sample) | 3.0% | 7.0% |
| Standard Deviation (Population) | 2.9% | 7.0% |
Similar Demographics by 4 or more Vehicles in Household
Demographics Similar to Immigrants from Hungary by 4 or more Vehicles in Household
In terms of 4 or more vehicles in household, the demographic groups most similar to Immigrants from Hungary are Immigrants from Eritrea (5.8%, a difference of 0.010%), African (5.8%, a difference of 0.020%), Turkish (5.8%, a difference of 0.29%), Immigrants from Belgium (5.8%, a difference of 0.41%), and Immigrants from Australia (5.8%, a difference of 0.51%).
| Demographics | Rating | Rank | 4 or more Vehicles in Household |
| Immigrants | Uganda | 7.5 /100 | #228 | Tragic 5.9% |
| Eastern Europeans | 6.8 /100 | #229 | Tragic 5.9% |
| Immigrants | Malaysia | 6.7 /100 | #230 | Tragic 5.9% |
| Immigrants | Switzerland | 6.4 /100 | #231 | Tragic 5.9% |
| Immigrants | Argentina | 6.0 /100 | #232 | Tragic 5.9% |
| Sierra Leoneans | 6.0 /100 | #233 | Tragic 5.9% |
| Africans | 4.6 /100 | #234 | Tragic 5.8% |
| Immigrants | Hungary | 4.6 /100 | #235 | Tragic 5.8% |
| Immigrants | Eritrea | 4.5 /100 | #236 | Tragic 5.8% |
| Turks | 4.1 /100 | #237 | Tragic 5.8% |
| Immigrants | Belgium | 4.0 /100 | #238 | Tragic 5.8% |
| Immigrants | Australia | 3.8 /100 | #239 | Tragic 5.8% |
| Immigrants | Poland | 3.8 /100 | #240 | Tragic 5.8% |
| Mongolians | 3.7 /100 | #241 | Tragic 5.8% |
| Immigrants | Middle Africa | 3.4 /100 | #242 | Tragic 5.8% |
Demographics Similar to Celtics by 4 or more Vehicles in Household
In terms of 4 or more vehicles in household, the demographic groups most similar to Celtics are Central American (7.1%, a difference of 0.35%), Czechoslovakian (7.1%, a difference of 0.37%), Irish (7.1%, a difference of 0.42%), Dutch West Indian (7.1%, a difference of 0.58%), and Immigrants from Afghanistan (7.1%, a difference of 0.59%).
| Demographics | Rating | Rank | 4 or more Vehicles in Household |
| Creek | 99.6 /100 | #90 | Exceptional 7.2% |
| Assyrians/Chaldeans/Syriacs | 99.4 /100 | #91 | Exceptional 7.2% |
| Immigrants | Latin America | 99.4 /100 | #92 | Exceptional 7.1% |
| Immigrants | Afghanistan | 99.3 /100 | #93 | Exceptional 7.1% |
| Dutch West Indians | 99.3 /100 | #94 | Exceptional 7.1% |
| Czechoslovakians | 99.3 /100 | #95 | Exceptional 7.1% |
| Central Americans | 99.3 /100 | #96 | Exceptional 7.1% |
| Celtics | 99.1 /100 | #97 | Exceptional 7.1% |
| Irish | 99.0 /100 | #98 | Exceptional 7.1% |
| Seminole | 98.8 /100 | #99 | Exceptional 7.0% |
| Taiwanese | 98.7 /100 | #100 | Exceptional 7.0% |
| Pakistanis | 98.7 /100 | #101 | Exceptional 7.0% |
| Asians | 98.6 /100 | #102 | Exceptional 7.0% |
| Blackfeet | 98.6 /100 | #103 | Exceptional 7.0% |
| Hmong | 98.3 /100 | #104 | Exceptional 7.0% |