Immigrants from Hungary vs Black/African American 4 or more Vehicles in Household
COMPARE
Immigrants from Hungary
Black/African American
4 or more Vehicles in Household
4 or more Vehicles in Household Comparison
Immigrants from Hungary
Blacks/African Americans
5.8%
4 OR MORE VEHICLES IN HOUSEHOLD
4.6/ 100
METRIC RATING
235th/ 347
METRIC RANK
5.5%
4 OR MORE VEHICLES IN HOUSEHOLD
0.6/ 100
METRIC RATING
274th/ 347
METRIC RANK
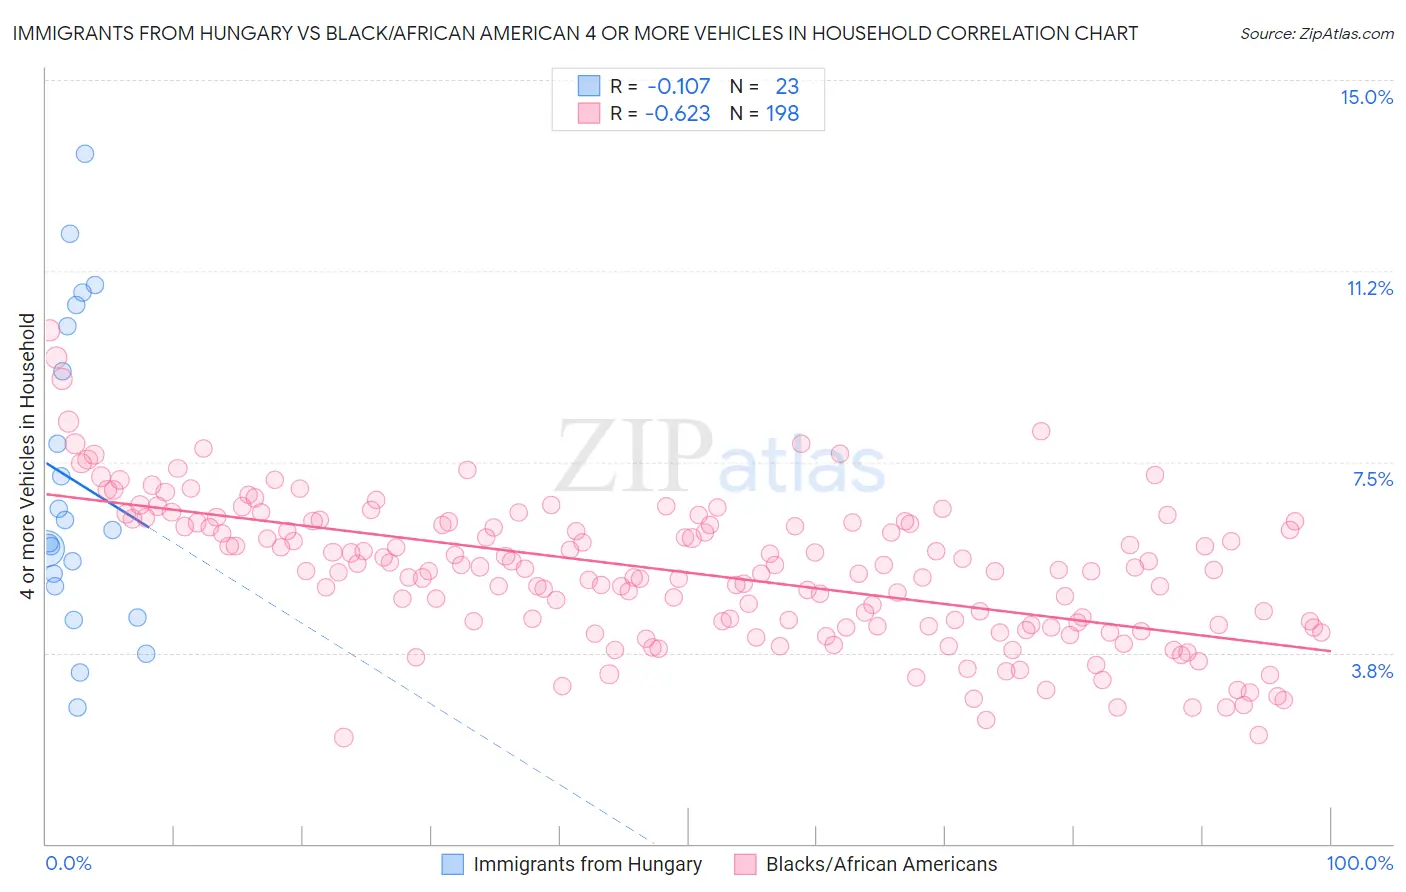
Immigrants from Hungary vs Black/African American 4 or more Vehicles in Household Correlation Chart
The statistical analysis conducted on geographies consisting of 194,934,489 people shows a poor negative correlation between the proportion of Immigrants from Hungary and percentage of households with 4 or more vehicles available in the United States with a correlation coefficient (R) of -0.107 and weighted average of 5.8%. Similarly, the statistical analysis conducted on geographies consisting of 562,244,951 people shows a significant negative correlation between the proportion of Blacks/African Americans and percentage of households with 4 or more vehicles available in the United States with a correlation coefficient (R) of -0.623 and weighted average of 5.5%, a difference of 6.2%.
4 or more Vehicles in Household Correlation Summary
| Measurement | Immigrants from Hungary | Black/African American |
| Minimum | 2.7% | 2.1% |
| Maximum | 13.6% | 10.1% |
| Range | 10.9% | 8.0% |
| Mean | 7.1% | 5.3% |
| Median | 6.2% | 5.4% |
| Interquartile 25% (IQ1) | 5.1% | 4.3% |
| Interquartile 75% (IQ3) | 10.2% | 6.3% |
| Interquartile Range (IQR) | 5.1% | 2.0% |
| Standard Deviation (Sample) | 3.0% | 1.4% |
| Standard Deviation (Population) | 2.9% | 1.4% |
Similar Demographics by 4 or more Vehicles in Household
Demographics Similar to Immigrants from Hungary by 4 or more Vehicles in Household
In terms of 4 or more vehicles in household, the demographic groups most similar to Immigrants from Hungary are Immigrants from Eritrea (5.8%, a difference of 0.010%), African (5.8%, a difference of 0.020%), Turkish (5.8%, a difference of 0.29%), Immigrants from Belgium (5.8%, a difference of 0.41%), and Immigrants from Australia (5.8%, a difference of 0.51%).
| Demographics | Rating | Rank | 4 or more Vehicles in Household |
| Immigrants | Uganda | 7.5 /100 | #228 | Tragic 5.9% |
| Eastern Europeans | 6.8 /100 | #229 | Tragic 5.9% |
| Immigrants | Malaysia | 6.7 /100 | #230 | Tragic 5.9% |
| Immigrants | Switzerland | 6.4 /100 | #231 | Tragic 5.9% |
| Immigrants | Argentina | 6.0 /100 | #232 | Tragic 5.9% |
| Sierra Leoneans | 6.0 /100 | #233 | Tragic 5.9% |
| Africans | 4.6 /100 | #234 | Tragic 5.8% |
| Immigrants | Hungary | 4.6 /100 | #235 | Tragic 5.8% |
| Immigrants | Eritrea | 4.5 /100 | #236 | Tragic 5.8% |
| Turks | 4.1 /100 | #237 | Tragic 5.8% |
| Immigrants | Belgium | 4.0 /100 | #238 | Tragic 5.8% |
| Immigrants | Australia | 3.8 /100 | #239 | Tragic 5.8% |
| Immigrants | Poland | 3.8 /100 | #240 | Tragic 5.8% |
| Mongolians | 3.7 /100 | #241 | Tragic 5.8% |
| Immigrants | Middle Africa | 3.4 /100 | #242 | Tragic 5.8% |
Demographics Similar to Blacks/African Americans by 4 or more Vehicles in Household
In terms of 4 or more vehicles in household, the demographic groups most similar to Blacks/African Americans are Macedonian (5.5%, a difference of 0.12%), Cambodian (5.5%, a difference of 0.12%), Immigrants from Latvia (5.5%, a difference of 0.13%), Immigrants from Kazakhstan (5.5%, a difference of 0.15%), and Immigrants from Bulgaria (5.5%, a difference of 0.25%).
| Demographics | Rating | Rank | 4 or more Vehicles in Household |
| Immigrants | Ukraine | 0.9 /100 | #267 | Tragic 5.6% |
| Colombians | 0.7 /100 | #268 | Tragic 5.5% |
| Carpatho Rusyns | 0.7 /100 | #269 | Tragic 5.5% |
| Okinawans | 0.6 /100 | #270 | Tragic 5.5% |
| Immigrants | Sudan | 0.6 /100 | #271 | Tragic 5.5% |
| Immigrants | Kazakhstan | 0.6 /100 | #272 | Tragic 5.5% |
| Macedonians | 0.6 /100 | #273 | Tragic 5.5% |
| Blacks/African Americans | 0.6 /100 | #274 | Tragic 5.5% |
| Cambodians | 0.5 /100 | #275 | Tragic 5.5% |
| Immigrants | Latvia | 0.5 /100 | #276 | Tragic 5.5% |
| Immigrants | Bulgaria | 0.5 /100 | #277 | Tragic 5.5% |
| Immigrants | Eastern Europe | 0.4 /100 | #278 | Tragic 5.4% |
| Immigrants | Uruguay | 0.3 /100 | #279 | Tragic 5.4% |
| Alsatians | 0.3 /100 | #280 | Tragic 5.4% |
| Immigrants | Western Africa | 0.3 /100 | #281 | Tragic 5.4% |