Immigrants from Hungary vs Brazilian 4 or more Vehicles in Household

COMPARE

Immigrants from Hungary
Race
Ancestry
AfghanAfricanAlaska NativeAlaskan AthabascanAlbanianAleutAlsatianAmericanApacheArabArapahoArgentineanArmenianAssyrian/Chaldean/SyriacAustralianAustrianBahamianBangladeshiBarbadianBasqueBelgianBelizeanBermudanBhutaneseBlackfeetBolivianBritishBritish West IndianBulgarianBurmeseCajunCambodianCanadianCape VerdeanCarpatho RusynCelticCentral AmericanCentral American IndianCherokeeCheyenneChickasawChileanChineseChippewaChoctawColombianColvilleComancheCosta RicanCreeCreekCroatianCrowCubanCypriotCzechCzechoslovakianDanishDelawareDominicanDutchDutch West IndianEastern EuropeanEcuadorianEgyptianEnglishEstonianEthiopianEuropeanFijianFilipinoFinnishFrenchFrench American IndianFrench CanadianGermanGerman RussianGhanaianGreekGuamanian/ChamorroGuatemalanGuyaneseHaitianHmongHonduranHopiHoumaHungarianIcelanderIndian (Asian)IndonesianInupiatIranianIraqiIrishIroquoisIsraeliItalianJamaicanJapaneseJordanianKenyanKiowaKoreanLaotianLatvianLebaneseLiberianLithuanianLumbeeLuxembourgerMacedonianMalaysianMalteseMarshalleseMenomineeMexicanMexican American IndianMongolianMoroccanNative HawaiianNavajoNepaleseNew ZealanderNicaraguanNigerianNorthern EuropeanNorwegianOkinawanOsageOttawaPaiutePakistaniPalestinianPanamanianParaguayanPennsylvania GermanPeruvianPimaPolishPortuguesePotawatomiPuebloPuerto RicanPuget Sound SalishRomanianRussianSalvadoranSamoanScandinavianScotch-IrishScottishSeminoleSenegaleseSerbianShoshoneSierra LeoneanSiouxSlavicSlovakSloveneSomaliSouth AfricanSouth AmericanSouth American IndianSoviet UnionSpaniardSpanishSpanish AmericanSpanish American IndianSri LankanSubsaharan AfricanSudaneseSwedishSwissSyrianTaiwaneseThaiTlingit-HaidaTohono O'OdhamTonganTrinidadian and TobagonianTsimshianTurkishU.S. Virgin IslanderUgandanUkrainianUruguayanUteVenezuelanVietnameseWelshWest IndianYakamaYaquiYugoslavianYumanYup'ikZimbabwean
Immigration
NonimmigrantsImmigrantsAfghanistanAfricaAlbaniaArgentinaArmeniaAsiaAustraliaAustriaBahamasBangladeshBarbadosBelarusBelgiumBelizeBoliviaBosnia and HerzegovinaBrazilBulgariaBurma/MyanmarCabo VerdeCambodiaCameroonCanadaCaribbeanCentral AmericaChileChinaColombiaCongoCosta RicaCroatiaCubaCzechoslovakiaDenmarkDominicaDominican RepublicEastern AfricaEastern AsiaEastern EuropeEcuadorEgyptEl SalvadorEnglandEritreaEthiopiaEuropeFijiFranceGermanyGhanaGreeceGrenadaGuatemalaGuyanaHaitiHondurasHong KongHungaryIndiaIndonesiaIranIraqIrelandIsraelItalyJamaicaJapanJordanKazakhstanKenyaKoreaKuwaitLaosLatin AmericaLatviaLebanonLiberiaLithuaniaMalaysiaMexicoMicronesiaMiddle AfricaMoldovaMoroccoNepalNetherlandsNicaraguaNigeriaNorth AmericaNorth MacedoniaNorthern AfricaNorthern EuropeNorwayOceaniaPakistanPanamaPeruPhilippinesPolandPortugalRomaniaRussiaSaudi ArabiaScotlandSenegalSerbiaSierra LeoneSingaporeSomaliaSouth AfricaSouth AmericaSouth Central AsiaSouth Eastern AsiaSouthern EuropeSpainSri LankaSt. Vincent and the GrenadinesSudanSwedenSwitzerlandSyriaTaiwanThailandTrinidad and TobagoTurkeyUgandaUkraineUruguayUzbekistanVenezuelaVietnamWest IndiesWestern AfricaWestern AsiaWestern EuropeYemenZaireZimbabweAzores
Brazilian
Race
Ancestry
AfghanAfricanAlaska NativeAlaskan AthabascanAlbanianAleutAlsatianAmericanApacheArabArapahoArgentineanArmenianAssyrian/Chaldean/SyriacAustralianAustrianBahamianBangladeshiBarbadianBasqueBelgianBelizeanBermudanBhutaneseBlackfeetBolivianBrazilianBritishBritish West IndianBulgarianBurmeseCajunCambodianCanadianCape VerdeanCarpatho RusynCelticCentral AmericanCentral American IndianCherokeeCheyenneChickasawChileanChineseChippewaChoctawColombianColvilleComancheCosta RicanCreeCreekCroatianCrowCubanCypriotCzechCzechoslovakianDanishDelawareDominicanDutchDutch West IndianEastern EuropeanEcuadorianEgyptianEnglishEstonianEthiopianEuropeanFijianFilipinoFinnishFrenchFrench American IndianFrench CanadianGermanGerman RussianGhanaianGreekGuamanian/ChamorroGuatemalanGuyaneseHaitianHmongHonduranHopiHoumaHungarianIcelanderIndian (Asian)IndonesianInupiatIranianIraqiIrishIroquoisIsraeliItalianJamaicanJapaneseJordanianKenyanKiowaKoreanLaotianLatvianLebaneseLiberianLithuanianLumbeeLuxembourgerMacedonianMalaysianMalteseMarshalleseMenomineeMexicanMexican American IndianMongolianMoroccanNative HawaiianNavajoNepaleseNew ZealanderNicaraguanNigerianNorthern EuropeanNorwegianOkinawanOsageOttawaPaiutePakistaniPalestinianPanamanianParaguayanPennsylvania GermanPeruvianPimaPolishPortuguesePotawatomiPuebloPuerto RicanPuget Sound SalishRomanianRussianSalvadoranSamoanScandinavianScotch-IrishScottishSeminoleSenegaleseSerbianShoshoneSierra LeoneanSiouxSlavicSlovakSloveneSomaliSouth AfricanSouth AmericanSouth American IndianSoviet UnionSpaniardSpanishSpanish AmericanSpanish American IndianSri LankanSubsaharan AfricanSudaneseSwedishSwissSyrianTaiwaneseThaiTlingit-HaidaTohono O'OdhamTonganTrinidadian and TobagonianTsimshianTurkishU.S. Virgin IslanderUgandanUkrainianUruguayanUteVenezuelanVietnameseWelshWest IndianYakamaYaquiYugoslavianYumanYup'ikZimbabwean
Immigration
NonimmigrantsImmigrantsAfghanistanAfricaAlbaniaArgentinaArmeniaAsiaAustraliaAustriaBahamasBangladeshBarbadosBelarusBelgiumBelizeBoliviaBosnia and HerzegovinaBrazilBulgariaBurma/MyanmarCabo VerdeCambodiaCameroonCanadaCaribbeanCentral AmericaChileChinaColombiaCongoCosta RicaCroatiaCubaCzechoslovakiaDenmarkDominicaDominican RepublicEastern AfricaEastern AsiaEastern EuropeEcuadorEgyptEl SalvadorEnglandEritreaEthiopiaEuropeFijiFranceGermanyGhanaGreeceGrenadaGuatemalaGuyanaHaitiHondurasHong KongIndiaIndonesiaIranIraqIrelandIsraelItalyJamaicaJapanJordanKazakhstanKenyaKoreaKuwaitLaosLatin AmericaLatviaLebanonLiberiaLithuaniaMalaysiaMexicoMicronesiaMiddle AfricaMoldovaMoroccoNepalNetherlandsNicaraguaNigeriaNorth AmericaNorth MacedoniaNorthern AfricaNorthern EuropeNorwayOceaniaPakistanPanamaPeruPhilippinesPolandPortugalRomaniaRussiaSaudi ArabiaScotlandSenegalSerbiaSierra LeoneSingaporeSomaliaSouth AfricaSouth AmericaSouth Central AsiaSouth Eastern AsiaSouthern EuropeSpainSri LankaSt. Vincent and the GrenadinesSudanSwedenSwitzerlandSyriaTaiwanThailandTrinidad and TobagoTurkeyUgandaUkraineUruguayUzbekistanVenezuelaVietnamWest IndiesWestern AfricaWestern AsiaWestern EuropeYemenZaireZimbabweAzores
4 or more Vehicles in Household
Income
Poverty
Unemployment
Labor Participation
Family Structure
Vehicle Availability
Education Level
Disability

4 or more Vehicles in Household Comparison

Immigrants from Hungary

Brazilians

Tragic
Tragic
5.8%
4 OR MORE VEHICLES IN HOUSEHOLD
4.6/ 100
METRIC RATING
235th/ 347
METRIC RANK
5.4%
4 OR MORE VEHICLES IN HOUSEHOLD
0.3/ 100
METRIC RATING
284th/ 347
METRIC RANK

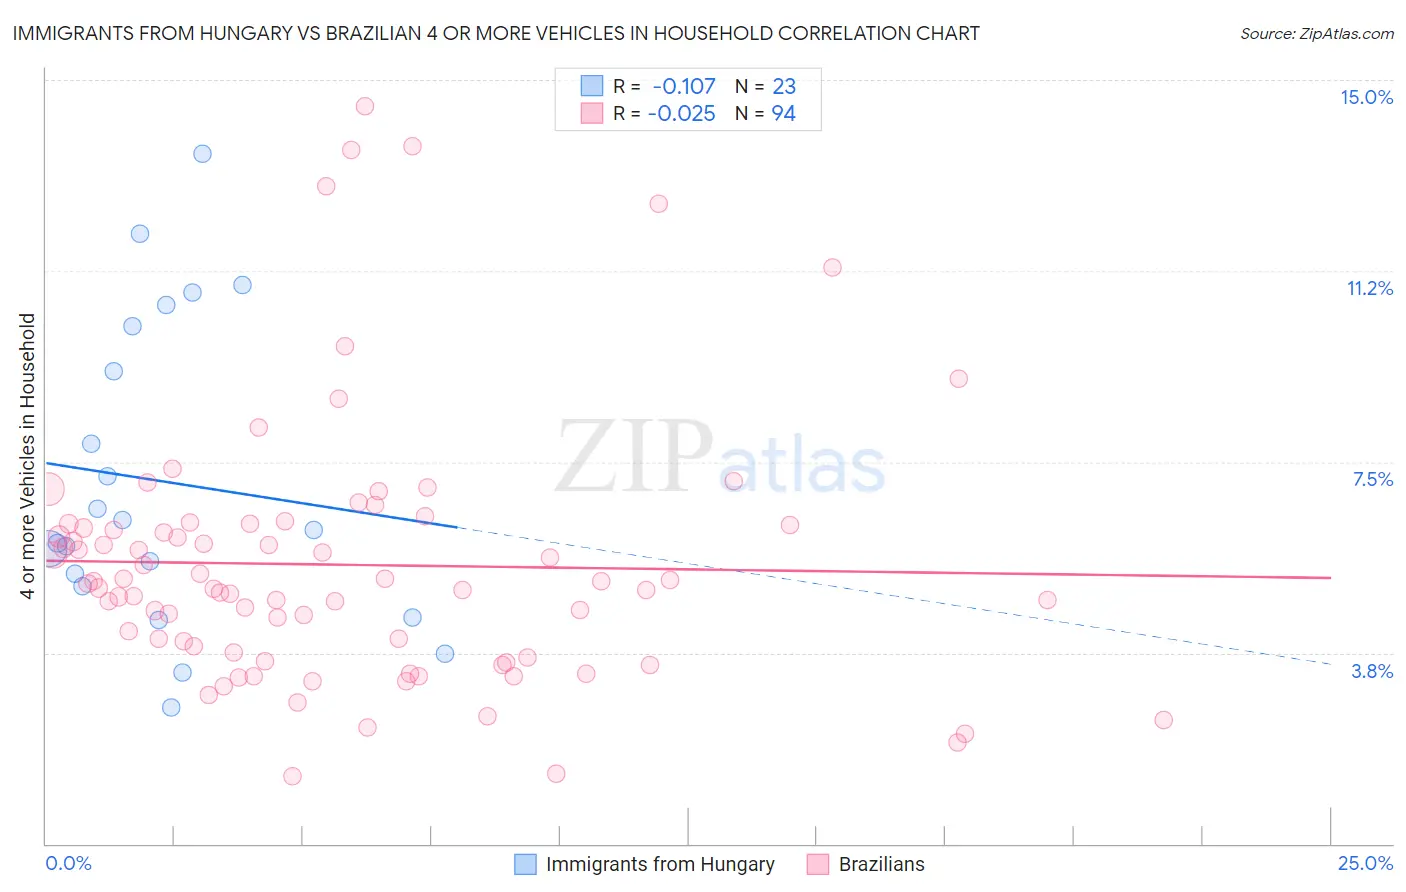
Immigrants from Hungary vs Brazilian 4 or more Vehicles in Household Correlation Chart

The statistical analysis conducted on geographies consisting of 194,934,489 people shows a poor negative correlation between the proportion of Immigrants from Hungary and percentage of households with 4 or more vehicles available in the United States with a correlation coefficient (R) of -0.107 and weighted average of 5.8%. Similarly, the statistical analysis conducted on geographies consisting of 322,327,740 people shows no correlation between the proportion of Brazilians and percentage of households with 4 or more vehicles available in the United States with a correlation coefficient (R) of -0.025 and weighted average of 5.4%, a difference of 8.6%.
Immigrants from Hungary vs Brazilian 4 or more Vehicles in Household

4 or more Vehicles in Household Correlation Summary

MeasurementImmigrants from HungaryBrazilian
Minimum2.7%1.3%
Maximum13.6%14.5%
Range10.9%13.2%
Mean7.1%5.5%
Median6.2%5.1%
Interquartile 25% (IQ1)5.1%3.7%
Interquartile 75% (IQ3)10.2%6.3%
Interquartile Range (IQR)5.1%2.5%
Standard Deviation (Sample)3.0%2.6%
Standard Deviation (Population)2.9%2.6%

Similar Demographics by 4 or more Vehicles in Household

Demographics Similar to Immigrants from Hungary by 4 or more Vehicles in Household

In terms of 4 or more vehicles in household, the demographic groups most similar to Immigrants from Hungary are Immigrants from Eritrea (5.8%, a difference of 0.010%), African (5.8%, a difference of 0.020%), Turkish (5.8%, a difference of 0.29%), Immigrants from Belgium (5.8%, a difference of 0.41%), and Immigrants from Australia (5.8%, a difference of 0.51%).
DemographicsRating | Rank4 or more Vehicles in Household
Immigrants | Uganda
7.5
/100
|
#228
Tragic
5.9%
Eastern Europeans
6.8
/100
|
#229
Tragic
5.9%
Immigrants | Malaysia
6.7
/100
|
#230
Tragic
5.9%
Immigrants | Switzerland
6.4
/100
|
#231
Tragic
5.9%
Immigrants | Argentina
6.0
/100
|
#232
Tragic
5.9%
Sierra Leoneans
6.0
/100
|
#233
Tragic
5.9%
Africans
4.6
/100
|
#234
Tragic
5.8%
Immigrants | Hungary
4.6
/100
|
#235
Tragic
5.8%
Immigrants | Eritrea
4.5
/100
|
#236
Tragic
5.8%
Turks
4.1
/100
|
#237
Tragic
5.8%
Immigrants | Belgium
4.0
/100
|
#238
Tragic
5.8%
Immigrants | Australia
3.8
/100
|
#239
Tragic
5.8%
Immigrants | Poland
3.8
/100
|
#240
Tragic
5.8%
Mongolians
3.7
/100
|
#241
Tragic
5.8%
Immigrants | Middle Africa
3.4
/100
|
#242
Tragic
5.8%

Demographics Similar to Brazilians by 4 or more Vehicles in Household

In terms of 4 or more vehicles in household, the demographic groups most similar to Brazilians are Immigrants from Ireland (5.4%, a difference of 0.29%), Immigrants from Liberia (5.4%, a difference of 0.34%), Immigrants from Spain (5.4%, a difference of 0.37%), Immigrants from Colombia (5.4%, a difference of 0.38%), and Immigrants from Croatia (5.4%, a difference of 0.47%).
DemographicsRating | Rank4 or more Vehicles in Household
Immigrants | Bulgaria
0.5
/100
|
#277
Tragic
5.5%
Immigrants | Eastern Europe
0.4
/100
|
#278
Tragic
5.4%
Immigrants | Uruguay
0.3
/100
|
#279
Tragic
5.4%
Alsatians
0.3
/100
|
#280
Tragic
5.4%
Immigrants | Western Africa
0.3
/100
|
#281
Tragic
5.4%
Immigrants | Spain
0.3
/100
|
#282
Tragic
5.4%
Immigrants | Ireland
0.3
/100
|
#283
Tragic
5.4%
Brazilians
0.3
/100
|
#284
Tragic
5.4%
Immigrants | Liberia
0.2
/100
|
#285
Tragic
5.4%
Immigrants | Colombia
0.2
/100
|
#286
Tragic
5.4%
Immigrants | Croatia
0.2
/100
|
#287
Tragic
5.4%
Venezuelans
0.2
/100
|
#288
Tragic
5.3%
Immigrants | Bosnia and Herzegovina
0.2
/100
|
#289
Tragic
5.3%
Immigrants | Russia
0.2
/100
|
#290
Tragic
5.3%
Immigrants | Bahamas
0.1
/100
|
#291
Tragic
5.3%