Chilean vs Nigerian 4 or more Vehicles in Household
COMPARE
Chilean
Nigerian
4 or more Vehicles in Household
4 or more Vehicles in Household Comparison
Chileans
Nigerians
6.4%
4 OR MORE VEHICLES IN HOUSEHOLD
61.2/ 100
METRIC RATING
163rd/ 347
METRIC RANK
6.0%
4 OR MORE VEHICLES IN HOUSEHOLD
12.2/ 100
METRIC RATING
217th/ 347
METRIC RANK
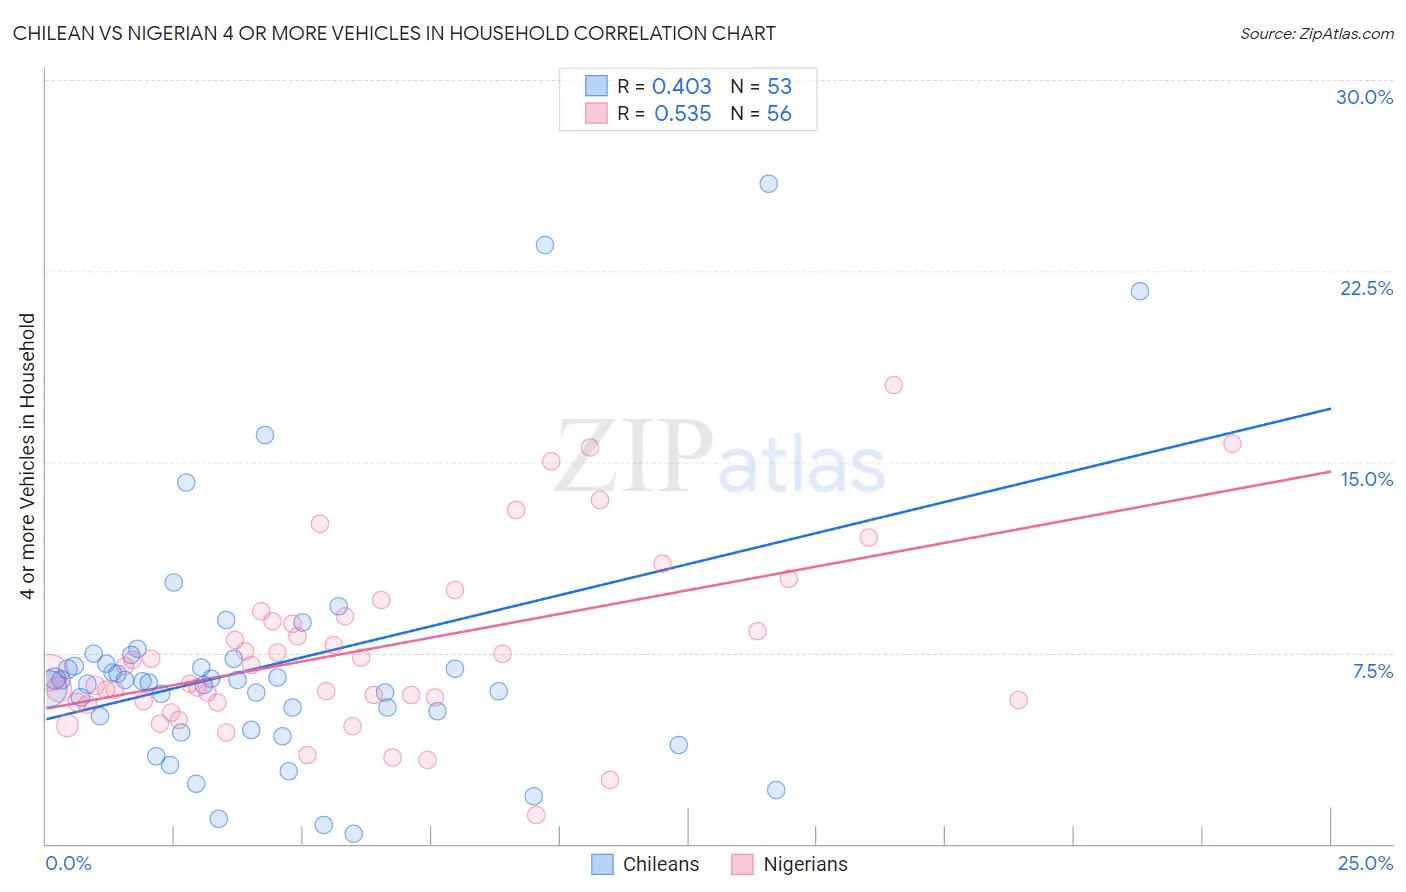
Chilean vs Nigerian 4 or more Vehicles in Household Correlation Chart
The statistical analysis conducted on geographies consisting of 255,549,782 people shows a moderate positive correlation between the proportion of Chileans and percentage of households with 4 or more vehicles available in the United States with a correlation coefficient (R) of 0.403 and weighted average of 6.4%. Similarly, the statistical analysis conducted on geographies consisting of 331,155,692 people shows a substantial positive correlation between the proportion of Nigerians and percentage of households with 4 or more vehicles available in the United States with a correlation coefficient (R) of 0.535 and weighted average of 6.0%, a difference of 6.5%.
4 or more Vehicles in Household Correlation Summary
| Measurement | Chilean | Nigerian |
| Minimum | 0.37% | 1.1% |
| Maximum | 25.9% | 18.0% |
| Range | 25.6% | 16.9% |
| Mean | 7.0% | 7.6% |
| Median | 6.4% | 6.9% |
| Interquartile 25% (IQ1) | 4.8% | 5.6% |
| Interquartile 75% (IQ3) | 7.2% | 8.8% |
| Interquartile Range (IQR) | 2.4% | 3.3% |
| Standard Deviation (Sample) | 5.0% | 3.5% |
| Standard Deviation (Population) | 4.9% | 3.4% |
Similar Demographics by 4 or more Vehicles in Household
Demographics Similar to Chileans by 4 or more Vehicles in Household
In terms of 4 or more vehicles in household, the demographic groups most similar to Chileans are Hungarian (6.4%, a difference of 0.010%), Immigrants from Peru (6.4%, a difference of 0.14%), Immigrants from Pakistan (6.4%, a difference of 0.22%), Immigrants from Cameroon (6.4%, a difference of 0.34%), and Immigrants from Denmark (6.4%, a difference of 0.35%).
| Demographics | Rating | Rank | 4 or more Vehicles in Household |
| Iranians | 69.9 /100 | #156 | Good 6.5% |
| Peruvians | 69.4 /100 | #157 | Good 6.5% |
| Zimbabweans | 67.1 /100 | #158 | Good 6.4% |
| Indians (Asian) | 66.3 /100 | #159 | Good 6.4% |
| Palestinians | 65.8 /100 | #160 | Good 6.4% |
| Immigrants | Cameroon | 64.4 /100 | #161 | Good 6.4% |
| Immigrants | Pakistan | 63.2 /100 | #162 | Good 6.4% |
| Chileans | 61.2 /100 | #163 | Good 6.4% |
| Hungarians | 61.1 /100 | #164 | Good 6.4% |
| Immigrants | Peru | 59.8 /100 | #165 | Average 6.4% |
| Immigrants | Denmark | 57.8 /100 | #166 | Average 6.4% |
| Poles | 56.9 /100 | #167 | Average 6.4% |
| Lebanese | 55.8 /100 | #168 | Average 6.4% |
| Estonians | 55.1 /100 | #169 | Average 6.4% |
| Immigrants | Syria | 52.8 /100 | #170 | Average 6.3% |
Demographics Similar to Nigerians by 4 or more Vehicles in Household
In terms of 4 or more vehicles in household, the demographic groups most similar to Nigerians are Immigrants from Italy (6.0%, a difference of 0.31%), Serbian (6.0%, a difference of 0.31%), Immigrants from China (6.0%, a difference of 0.39%), Immigrants from Romania (6.0%, a difference of 0.39%), and Immigrants from Austria (6.0%, a difference of 0.50%).
| Demographics | Rating | Rank | 4 or more Vehicles in Household |
| Immigrants | Zimbabwe | 15.1 /100 | #210 | Poor 6.0% |
| Panamanians | 14.8 /100 | #211 | Poor 6.0% |
| Immigrants | Egypt | 14.7 /100 | #212 | Poor 6.0% |
| Arabs | 14.4 /100 | #213 | Poor 6.0% |
| Immigrants | Austria | 14.3 /100 | #214 | Poor 6.0% |
| Immigrants | China | 13.8 /100 | #215 | Poor 6.0% |
| Immigrants | Romania | 13.8 /100 | #216 | Poor 6.0% |
| Nigerians | 12.2 /100 | #217 | Poor 6.0% |
| Immigrants | Italy | 11.0 /100 | #218 | Poor 6.0% |
| Serbians | 11.0 /100 | #219 | Poor 6.0% |
| Russians | 10.3 /100 | #220 | Poor 6.0% |
| Immigrants | Moldova | 9.3 /100 | #221 | Tragic 6.0% |
| Cajuns | 9.2 /100 | #222 | Tragic 6.0% |
| Immigrants | Kenya | 9.2 /100 | #223 | Tragic 6.0% |
| Cubans | 9.2 /100 | #224 | Tragic 6.0% |