Chilean vs Blackfeet 4 or more Vehicles in Household
COMPARE
Chilean
Blackfeet
4 or more Vehicles in Household
4 or more Vehicles in Household Comparison
Chileans
Blackfeet
6.4%
4 OR MORE VEHICLES IN HOUSEHOLD
61.2/ 100
METRIC RATING
163rd/ 347
METRIC RANK
7.0%
4 OR MORE VEHICLES IN HOUSEHOLD
98.6/ 100
METRIC RATING
103rd/ 347
METRIC RANK
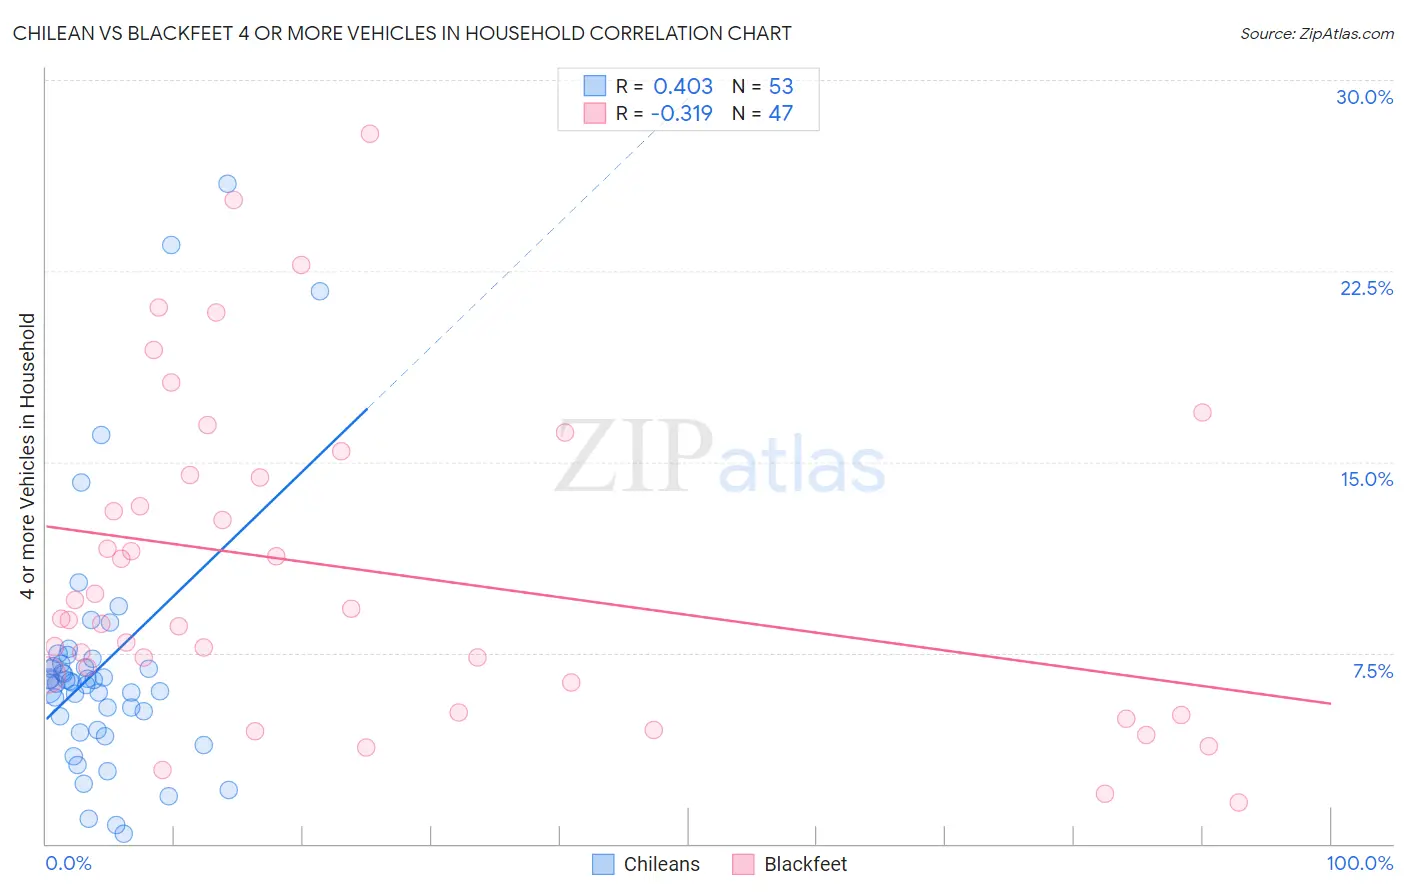
Chilean vs Blackfeet 4 or more Vehicles in Household Correlation Chart
The statistical analysis conducted on geographies consisting of 255,549,782 people shows a moderate positive correlation between the proportion of Chileans and percentage of households with 4 or more vehicles available in the United States with a correlation coefficient (R) of 0.403 and weighted average of 6.4%. Similarly, the statistical analysis conducted on geographies consisting of 308,735,015 people shows a mild negative correlation between the proportion of Blackfeet and percentage of households with 4 or more vehicles available in the United States with a correlation coefficient (R) of -0.319 and weighted average of 7.0%, a difference of 9.6%.
4 or more Vehicles in Household Correlation Summary
| Measurement | Chilean | Blackfeet |
| Minimum | 0.37% | 1.6% |
| Maximum | 25.9% | 27.9% |
| Range | 25.6% | 26.3% |
| Mean | 7.0% | 10.7% |
| Median | 6.4% | 8.8% |
| Interquartile 25% (IQ1) | 4.8% | 6.3% |
| Interquartile 75% (IQ3) | 7.2% | 14.5% |
| Interquartile Range (IQR) | 2.4% | 8.2% |
| Standard Deviation (Sample) | 5.0% | 6.3% |
| Standard Deviation (Population) | 4.9% | 6.2% |
Similar Demographics by 4 or more Vehicles in Household
Demographics Similar to Chileans by 4 or more Vehicles in Household
In terms of 4 or more vehicles in household, the demographic groups most similar to Chileans are Hungarian (6.4%, a difference of 0.010%), Immigrants from Peru (6.4%, a difference of 0.14%), Immigrants from Pakistan (6.4%, a difference of 0.22%), Immigrants from Cameroon (6.4%, a difference of 0.34%), and Immigrants from Denmark (6.4%, a difference of 0.35%).
| Demographics | Rating | Rank | 4 or more Vehicles in Household |
| Iranians | 69.9 /100 | #156 | Good 6.5% |
| Peruvians | 69.4 /100 | #157 | Good 6.5% |
| Zimbabweans | 67.1 /100 | #158 | Good 6.4% |
| Indians (Asian) | 66.3 /100 | #159 | Good 6.4% |
| Palestinians | 65.8 /100 | #160 | Good 6.4% |
| Immigrants | Cameroon | 64.4 /100 | #161 | Good 6.4% |
| Immigrants | Pakistan | 63.2 /100 | #162 | Good 6.4% |
| Chileans | 61.2 /100 | #163 | Good 6.4% |
| Hungarians | 61.1 /100 | #164 | Good 6.4% |
| Immigrants | Peru | 59.8 /100 | #165 | Average 6.4% |
| Immigrants | Denmark | 57.8 /100 | #166 | Average 6.4% |
| Poles | 56.9 /100 | #167 | Average 6.4% |
| Lebanese | 55.8 /100 | #168 | Average 6.4% |
| Estonians | 55.1 /100 | #169 | Average 6.4% |
| Immigrants | Syria | 52.8 /100 | #170 | Average 6.3% |
Demographics Similar to Blackfeet by 4 or more Vehicles in Household
In terms of 4 or more vehicles in household, the demographic groups most similar to Blackfeet are Asian (7.0%, a difference of 0.010%), Pakistani (7.0%, a difference of 0.080%), Taiwanese (7.0%, a difference of 0.15%), Seminole (7.0%, a difference of 0.22%), and Hmong (7.0%, a difference of 0.48%).
| Demographics | Rating | Rank | 4 or more Vehicles in Household |
| Central Americans | 99.3 /100 | #96 | Exceptional 7.1% |
| Celtics | 99.1 /100 | #97 | Exceptional 7.1% |
| Irish | 99.0 /100 | #98 | Exceptional 7.1% |
| Seminole | 98.8 /100 | #99 | Exceptional 7.0% |
| Taiwanese | 98.7 /100 | #100 | Exceptional 7.0% |
| Pakistanis | 98.7 /100 | #101 | Exceptional 7.0% |
| Asians | 98.6 /100 | #102 | Exceptional 7.0% |
| Blackfeet | 98.6 /100 | #103 | Exceptional 7.0% |
| Hmong | 98.3 /100 | #104 | Exceptional 7.0% |
| German Russians | 98.3 /100 | #105 | Exceptional 7.0% |
| Guatemalans | 98.1 /100 | #106 | Exceptional 7.0% |
| Nicaraguans | 98.0 /100 | #107 | Exceptional 7.0% |
| French | 97.7 /100 | #108 | Exceptional 6.9% |
| Filipinos | 97.6 /100 | #109 | Exceptional 6.9% |
| Immigrants | Thailand | 97.0 /100 | #110 | Exceptional 6.9% |