Chilean vs Marshallese 4 or more Vehicles in Household
COMPARE
Chilean
Marshallese
4 or more Vehicles in Household
4 or more Vehicles in Household Comparison
Chileans
Marshallese
6.4%
4 OR MORE VEHICLES IN HOUSEHOLD
61.2/ 100
METRIC RATING
163rd/ 347
METRIC RANK
8.1%
4 OR MORE VEHICLES IN HOUSEHOLD
100.0/ 100
METRIC RATING
32nd/ 347
METRIC RANK
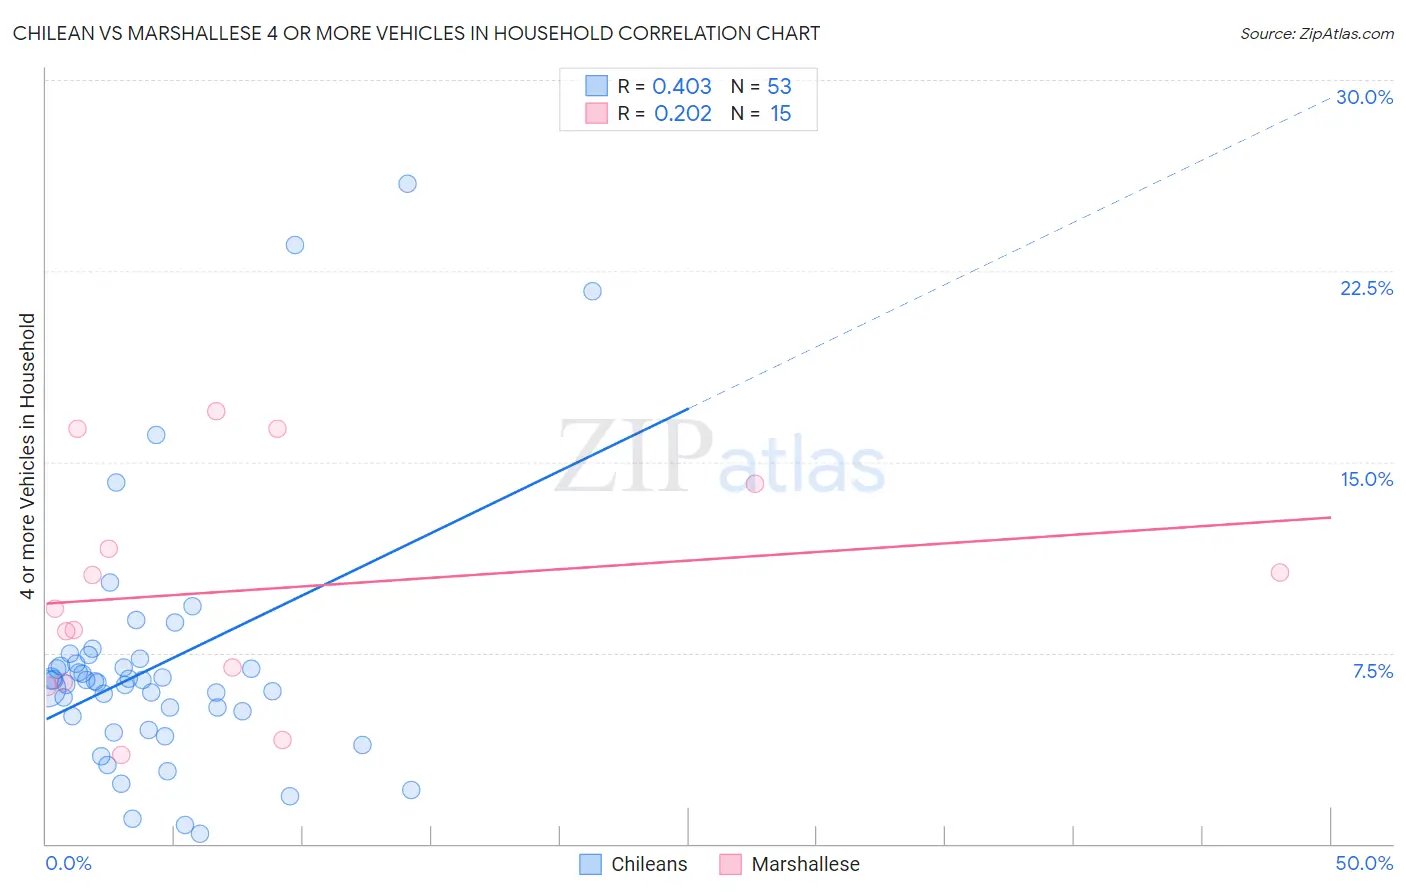
Chilean vs Marshallese 4 or more Vehicles in Household Correlation Chart
The statistical analysis conducted on geographies consisting of 255,549,782 people shows a moderate positive correlation between the proportion of Chileans and percentage of households with 4 or more vehicles available in the United States with a correlation coefficient (R) of 0.403 and weighted average of 6.4%. Similarly, the statistical analysis conducted on geographies consisting of 14,760,409 people shows a weak positive correlation between the proportion of Marshallese and percentage of households with 4 or more vehicles available in the United States with a correlation coefficient (R) of 0.202 and weighted average of 8.1%, a difference of 27.3%.
4 or more Vehicles in Household Correlation Summary
| Measurement | Chilean | Marshallese |
| Minimum | 0.37% | 3.5% |
| Maximum | 25.9% | 17.0% |
| Range | 25.6% | 13.5% |
| Mean | 7.0% | 10.0% |
| Median | 6.4% | 9.2% |
| Interquartile 25% (IQ1) | 4.8% | 6.3% |
| Interquartile 75% (IQ3) | 7.2% | 14.1% |
| Interquartile Range (IQR) | 2.4% | 7.8% |
| Standard Deviation (Sample) | 5.0% | 4.4% |
| Standard Deviation (Population) | 4.9% | 4.2% |
Similar Demographics by 4 or more Vehicles in Household
Demographics Similar to Chileans by 4 or more Vehicles in Household
In terms of 4 or more vehicles in household, the demographic groups most similar to Chileans are Hungarian (6.4%, a difference of 0.010%), Immigrants from Peru (6.4%, a difference of 0.14%), Immigrants from Pakistan (6.4%, a difference of 0.22%), Immigrants from Cameroon (6.4%, a difference of 0.34%), and Immigrants from Denmark (6.4%, a difference of 0.35%).
| Demographics | Rating | Rank | 4 or more Vehicles in Household |
| Iranians | 69.9 /100 | #156 | Good 6.5% |
| Peruvians | 69.4 /100 | #157 | Good 6.5% |
| Zimbabweans | 67.1 /100 | #158 | Good 6.4% |
| Indians (Asian) | 66.3 /100 | #159 | Good 6.4% |
| Palestinians | 65.8 /100 | #160 | Good 6.4% |
| Immigrants | Cameroon | 64.4 /100 | #161 | Good 6.4% |
| Immigrants | Pakistan | 63.2 /100 | #162 | Good 6.4% |
| Chileans | 61.2 /100 | #163 | Good 6.4% |
| Hungarians | 61.1 /100 | #164 | Good 6.4% |
| Immigrants | Peru | 59.8 /100 | #165 | Average 6.4% |
| Immigrants | Denmark | 57.8 /100 | #166 | Average 6.4% |
| Poles | 56.9 /100 | #167 | Average 6.4% |
| Lebanese | 55.8 /100 | #168 | Average 6.4% |
| Estonians | 55.1 /100 | #169 | Average 6.4% |
| Immigrants | Syria | 52.8 /100 | #170 | Average 6.3% |
Demographics Similar to Marshallese by 4 or more Vehicles in Household
In terms of 4 or more vehicles in household, the demographic groups most similar to Marshallese are Yaqui (8.1%, a difference of 0.29%), Native/Alaskan (8.2%, a difference of 0.53%), Alaskan Athabascan (8.1%, a difference of 0.89%), Navajo (8.2%, a difference of 0.94%), and Immigrants from South Eastern Asia (8.2%, a difference of 0.97%).
| Demographics | Rating | Rank | 4 or more Vehicles in Household |
| Basques | 100.0 /100 | #25 | Exceptional 8.4% |
| Mexican American Indians | 100.0 /100 | #26 | Exceptional 8.4% |
| Sri Lankans | 100.0 /100 | #27 | Exceptional 8.4% |
| Cheyenne | 100.0 /100 | #28 | Exceptional 8.3% |
| Immigrants | South Eastern Asia | 100.0 /100 | #29 | Exceptional 8.2% |
| Navajo | 100.0 /100 | #30 | Exceptional 8.2% |
| Natives/Alaskans | 100.0 /100 | #31 | Exceptional 8.2% |
| Marshallese | 100.0 /100 | #32 | Exceptional 8.1% |
| Yaqui | 100.0 /100 | #33 | Exceptional 8.1% |
| Alaskan Athabascans | 100.0 /100 | #34 | Exceptional 8.1% |
| Guamanians/Chamorros | 100.0 /100 | #35 | Exceptional 8.1% |
| Norwegians | 100.0 /100 | #36 | Exceptional 8.0% |
| Scandinavians | 100.0 /100 | #37 | Exceptional 8.0% |
| Sioux | 100.0 /100 | #38 | Exceptional 8.0% |
| Spanish Americans | 100.0 /100 | #39 | Exceptional 8.0% |