British vs Immigrants from Haiti 4 or more Vehicles in Household
COMPARE
British
Immigrants from Haiti
4 or more Vehicles in Household
4 or more Vehicles in Household Comparison
British
Immigrants from Haiti
7.2%
4 OR MORE VEHICLES IN HOUSEHOLD
99.6/ 100
METRIC RATING
89th/ 347
METRIC RANK
4.5%
4 OR MORE VEHICLES IN HOUSEHOLD
0.0/ 100
METRIC RATING
320th/ 347
METRIC RANK
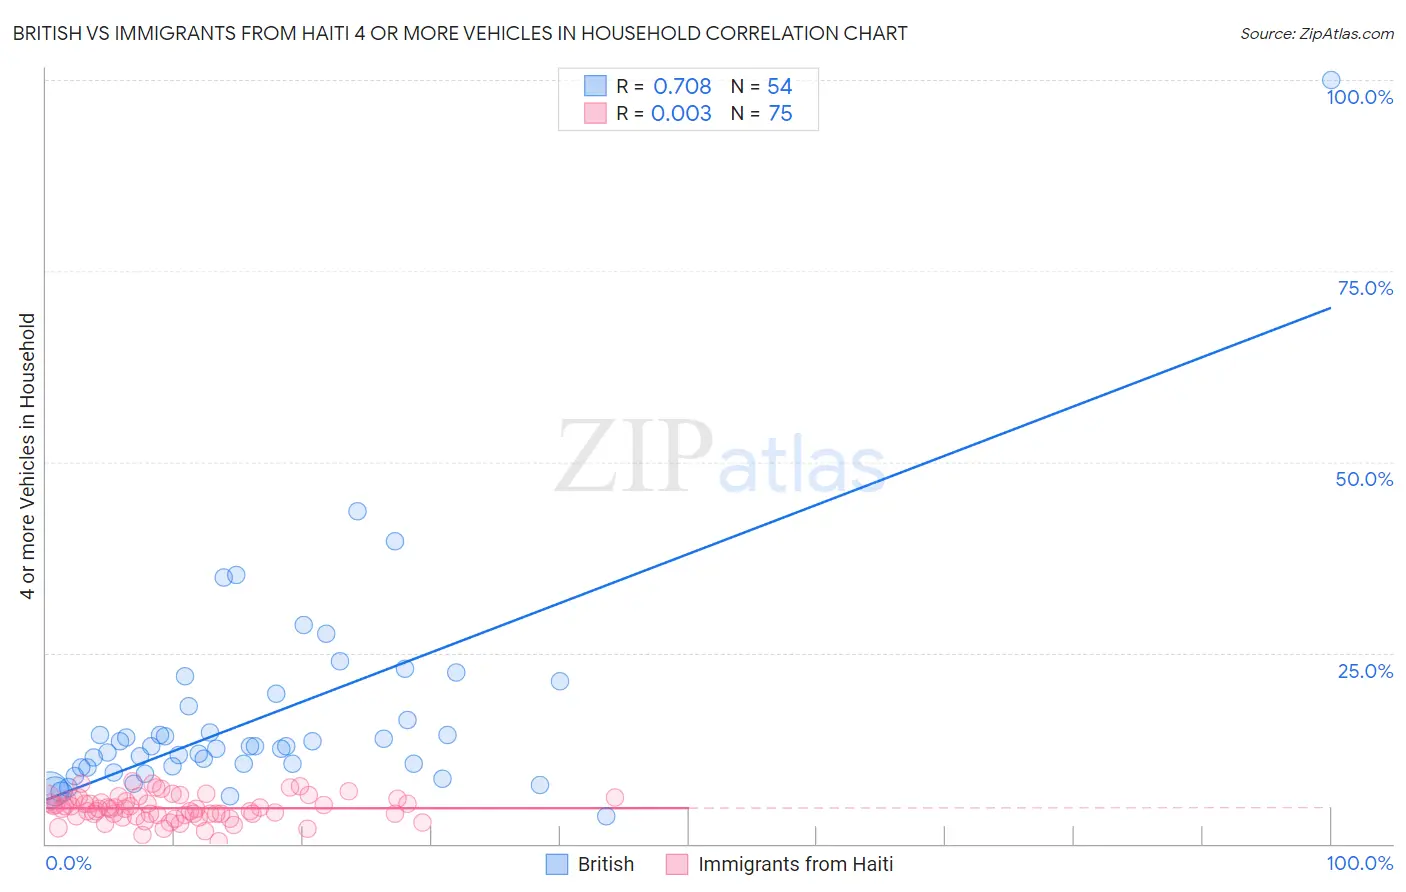
British vs Immigrants from Haiti 4 or more Vehicles in Household Correlation Chart
The statistical analysis conducted on geographies consisting of 528,748,745 people shows a strong positive correlation between the proportion of British and percentage of households with 4 or more vehicles available in the United States with a correlation coefficient (R) of 0.708 and weighted average of 7.2%. Similarly, the statistical analysis conducted on geographies consisting of 223,924,769 people shows no correlation between the proportion of Immigrants from Haiti and percentage of households with 4 or more vehicles available in the United States with a correlation coefficient (R) of 0.003 and weighted average of 4.5%, a difference of 60.0%.
4 or more Vehicles in Household Correlation Summary
| Measurement | British | Immigrants from Haiti |
| Minimum | 3.5% | 0.37% |
| Maximum | 100.0% | 8.2% |
| Range | 96.5% | 7.8% |
| Mean | 16.6% | 4.7% |
| Median | 12.7% | 4.6% |
| Interquartile 25% (IQ1) | 10.0% | 3.7% |
| Interquartile 75% (IQ3) | 18.0% | 5.8% |
| Interquartile Range (IQR) | 8.0% | 2.1% |
| Standard Deviation (Sample) | 14.4% | 1.6% |
| Standard Deviation (Population) | 14.2% | 1.6% |
Similar Demographics by 4 or more Vehicles in Household
Demographics Similar to British by 4 or more Vehicles in Household
In terms of 4 or more vehicles in household, the demographic groups most similar to British are Creek (7.2%, a difference of 0.080%), Nonimmigrants (7.2%, a difference of 0.33%), Delaware (7.2%, a difference of 0.35%), Immigrants from Indonesia (7.2%, a difference of 0.41%), and Cree (7.2%, a difference of 0.59%).
| Demographics | Rating | Rank | 4 or more Vehicles in Household |
| Northern Europeans | 99.8 /100 | #82 | Exceptional 7.3% |
| Potawatomi | 99.7 /100 | #83 | Exceptional 7.3% |
| Afghans | 99.7 /100 | #84 | Exceptional 7.3% |
| Cree | 99.7 /100 | #85 | Exceptional 7.2% |
| Immigrants | Indonesia | 99.6 /100 | #86 | Exceptional 7.2% |
| Delaware | 99.6 /100 | #87 | Exceptional 7.2% |
| Immigrants | Nonimmigrants | 99.6 /100 | #88 | Exceptional 7.2% |
| British | 99.6 /100 | #89 | Exceptional 7.2% |
| Creek | 99.6 /100 | #90 | Exceptional 7.2% |
| Assyrians/Chaldeans/Syriacs | 99.4 /100 | #91 | Exceptional 7.2% |
| Immigrants | Latin America | 99.4 /100 | #92 | Exceptional 7.1% |
| Immigrants | Afghanistan | 99.3 /100 | #93 | Exceptional 7.1% |
| Dutch West Indians | 99.3 /100 | #94 | Exceptional 7.1% |
| Czechoslovakians | 99.3 /100 | #95 | Exceptional 7.1% |
| Central Americans | 99.3 /100 | #96 | Exceptional 7.1% |
Demographics Similar to Immigrants from Haiti by 4 or more Vehicles in Household
In terms of 4 or more vehicles in household, the demographic groups most similar to Immigrants from Haiti are Ecuadorian (4.5%, a difference of 0.75%), Immigrants from Yemen (4.5%, a difference of 0.93%), Immigrants from Caribbean (4.4%, a difference of 1.3%), Soviet Union (4.4%, a difference of 1.6%), and Immigrants from Jamaica (4.4%, a difference of 1.9%).
| Demographics | Rating | Rank | 4 or more Vehicles in Household |
| Immigrants | Israel | 0.0 /100 | #313 | Tragic 4.8% |
| Immigrants | West Indies | 0.0 /100 | #314 | Tragic 4.7% |
| Immigrants | Belarus | 0.0 /100 | #315 | Tragic 4.7% |
| Puerto Ricans | 0.0 /100 | #316 | Tragic 4.7% |
| U.S. Virgin Islanders | 0.0 /100 | #317 | Tragic 4.6% |
| Jamaicans | 0.0 /100 | #318 | Tragic 4.6% |
| Haitians | 0.0 /100 | #319 | Tragic 4.6% |
| Immigrants | Haiti | 0.0 /100 | #320 | Tragic 4.5% |
| Ecuadorians | 0.0 /100 | #321 | Tragic 4.5% |
| Immigrants | Yemen | 0.0 /100 | #322 | Tragic 4.5% |
| Immigrants | Caribbean | 0.0 /100 | #323 | Tragic 4.4% |
| Soviet Union | 0.0 /100 | #324 | Tragic 4.4% |
| Immigrants | Jamaica | 0.0 /100 | #325 | Tragic 4.4% |
| Cape Verdeans | 0.0 /100 | #326 | Tragic 4.4% |
| Senegalese | 0.0 /100 | #327 | Tragic 4.3% |