British vs South American 4 or more Vehicles in Household
COMPARE
British
South American
4 or more Vehicles in Household
4 or more Vehicles in Household Comparison
British
South Americans
7.2%
4 OR MORE VEHICLES IN HOUSEHOLD
99.6/ 100
METRIC RATING
89th/ 347
METRIC RANK
5.6%
4 OR MORE VEHICLES IN HOUSEHOLD
0.9/ 100
METRIC RATING
265th/ 347
METRIC RANK
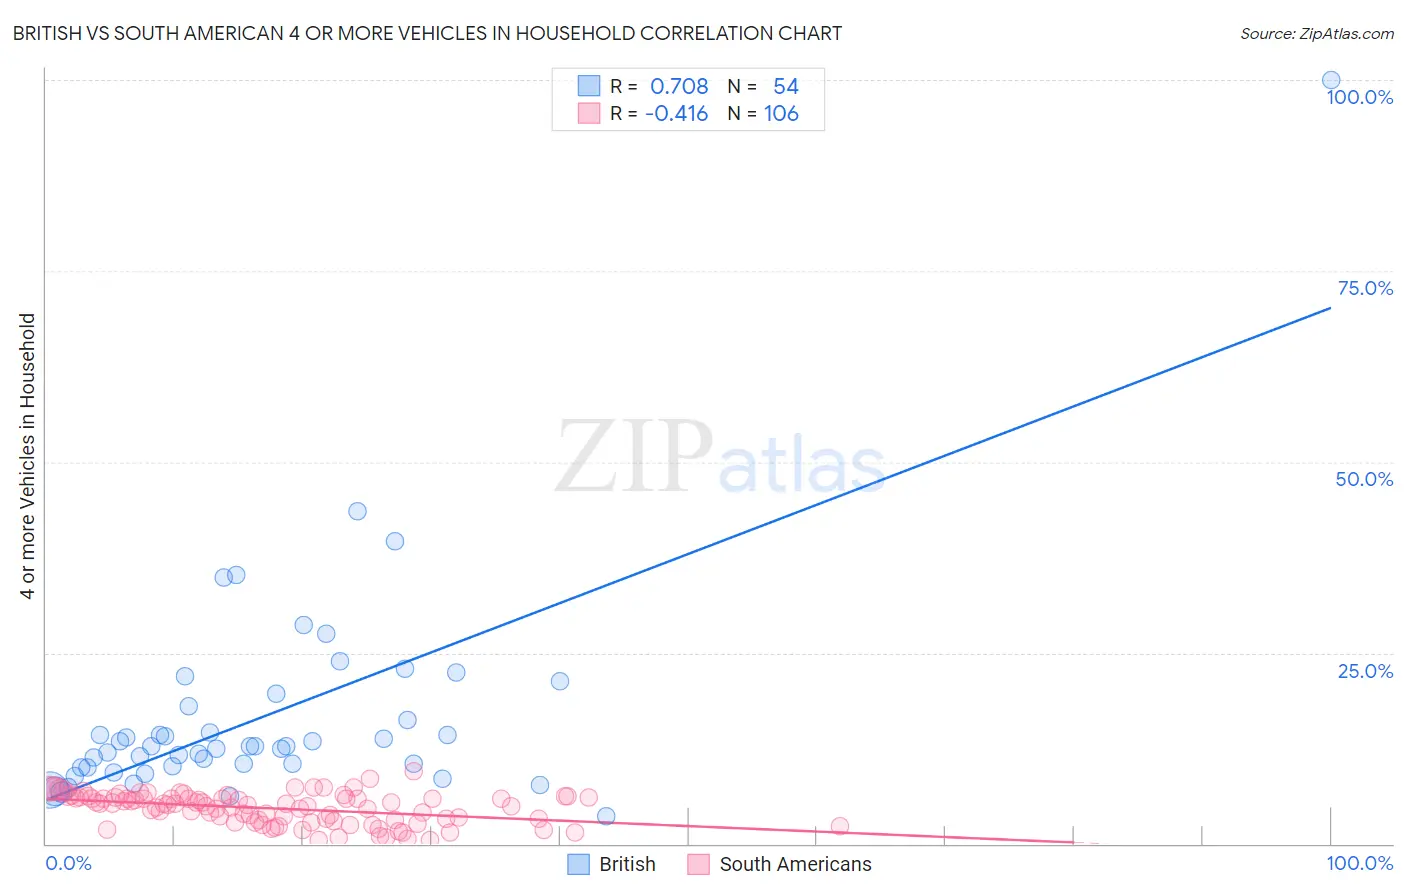
British vs South American 4 or more Vehicles in Household Correlation Chart
The statistical analysis conducted on geographies consisting of 528,748,745 people shows a strong positive correlation between the proportion of British and percentage of households with 4 or more vehicles available in the United States with a correlation coefficient (R) of 0.708 and weighted average of 7.2%. Similarly, the statistical analysis conducted on geographies consisting of 491,409,922 people shows a moderate negative correlation between the proportion of South Americans and percentage of households with 4 or more vehicles available in the United States with a correlation coefficient (R) of -0.416 and weighted average of 5.6%, a difference of 29.2%.
4 or more Vehicles in Household Correlation Summary
| Measurement | British | South American |
| Minimum | 3.5% | 0.44% |
| Maximum | 100.0% | 9.6% |
| Range | 96.5% | 9.1% |
| Mean | 16.6% | 4.6% |
| Median | 12.7% | 5.2% |
| Interquartile 25% (IQ1) | 10.0% | 3.2% |
| Interquartile 75% (IQ3) | 18.0% | 6.0% |
| Interquartile Range (IQR) | 8.0% | 2.8% |
| Standard Deviation (Sample) | 14.4% | 2.0% |
| Standard Deviation (Population) | 14.2% | 2.0% |
Similar Demographics by 4 or more Vehicles in Household
Demographics Similar to British by 4 or more Vehicles in Household
In terms of 4 or more vehicles in household, the demographic groups most similar to British are Creek (7.2%, a difference of 0.080%), Nonimmigrants (7.2%, a difference of 0.33%), Delaware (7.2%, a difference of 0.35%), Immigrants from Indonesia (7.2%, a difference of 0.41%), and Cree (7.2%, a difference of 0.59%).
| Demographics | Rating | Rank | 4 or more Vehicles in Household |
| Northern Europeans | 99.8 /100 | #82 | Exceptional 7.3% |
| Potawatomi | 99.7 /100 | #83 | Exceptional 7.3% |
| Afghans | 99.7 /100 | #84 | Exceptional 7.3% |
| Cree | 99.7 /100 | #85 | Exceptional 7.2% |
| Immigrants | Indonesia | 99.6 /100 | #86 | Exceptional 7.2% |
| Delaware | 99.6 /100 | #87 | Exceptional 7.2% |
| Immigrants | Nonimmigrants | 99.6 /100 | #88 | Exceptional 7.2% |
| British | 99.6 /100 | #89 | Exceptional 7.2% |
| Creek | 99.6 /100 | #90 | Exceptional 7.2% |
| Assyrians/Chaldeans/Syriacs | 99.4 /100 | #91 | Exceptional 7.2% |
| Immigrants | Latin America | 99.4 /100 | #92 | Exceptional 7.1% |
| Immigrants | Afghanistan | 99.3 /100 | #93 | Exceptional 7.1% |
| Dutch West Indians | 99.3 /100 | #94 | Exceptional 7.1% |
| Czechoslovakians | 99.3 /100 | #95 | Exceptional 7.1% |
| Central Americans | 99.3 /100 | #96 | Exceptional 7.1% |
Demographics Similar to South Americans by 4 or more Vehicles in Household
In terms of 4 or more vehicles in household, the demographic groups most similar to South Americans are Immigrants from Nepal (5.6%, a difference of 0.020%), Immigrants from Ukraine (5.6%, a difference of 0.11%), Immigrants from Africa (5.6%, a difference of 0.22%), Colombian (5.5%, a difference of 0.54%), and Carpatho Rusyn (5.5%, a difference of 0.69%).
| Demographics | Rating | Rank | 4 or more Vehicles in Household |
| Immigrants | Lithuania | 1.4 /100 | #258 | Tragic 5.6% |
| Immigrants | France | 1.3 /100 | #259 | Tragic 5.6% |
| Uruguayans | 1.3 /100 | #260 | Tragic 5.6% |
| Sudanese | 1.2 /100 | #261 | Tragic 5.6% |
| Bermudans | 1.2 /100 | #262 | Tragic 5.6% |
| Immigrants | Saudi Arabia | 1.1 /100 | #263 | Tragic 5.6% |
| Immigrants | Africa | 1.0 /100 | #264 | Tragic 5.6% |
| South Americans | 0.9 /100 | #265 | Tragic 5.6% |
| Immigrants | Nepal | 0.9 /100 | #266 | Tragic 5.6% |
| Immigrants | Ukraine | 0.9 /100 | #267 | Tragic 5.6% |
| Colombians | 0.7 /100 | #268 | Tragic 5.5% |
| Carpatho Rusyns | 0.7 /100 | #269 | Tragic 5.5% |
| Okinawans | 0.6 /100 | #270 | Tragic 5.5% |
| Immigrants | Sudan | 0.6 /100 | #271 | Tragic 5.5% |
| Immigrants | Kazakhstan | 0.6 /100 | #272 | Tragic 5.5% |