British vs Arapaho 4 or more Vehicles in Household
COMPARE
British
Arapaho
4 or more Vehicles in Household
4 or more Vehicles in Household Comparison
British
Arapaho
7.2%
4 OR MORE VEHICLES IN HOUSEHOLD
99.6/ 100
METRIC RATING
89th/ 347
METRIC RANK
9.4%
4 OR MORE VEHICLES IN HOUSEHOLD
100.0/ 100
METRIC RATING
8th/ 347
METRIC RANK
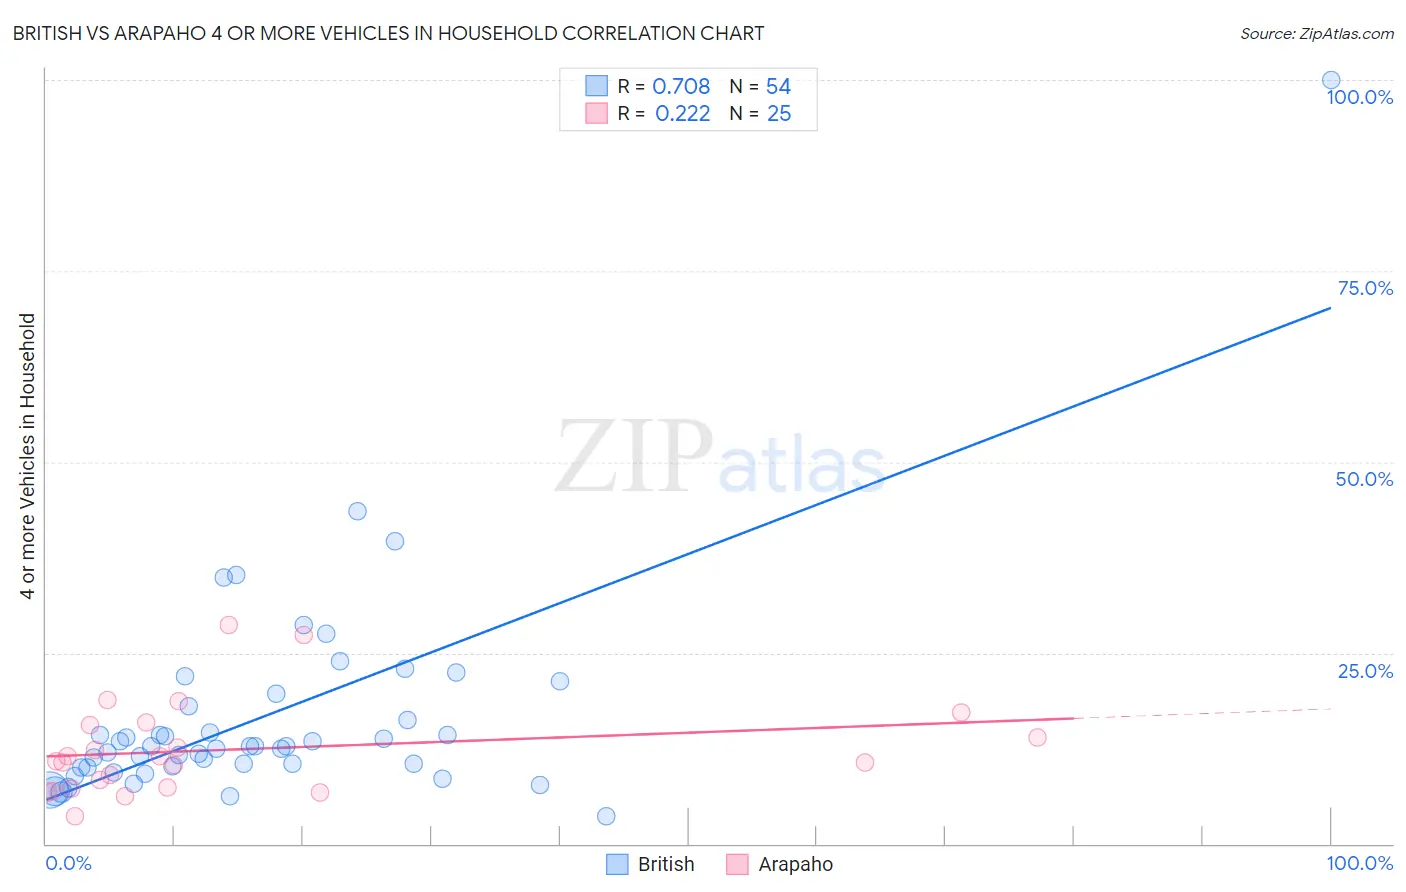
British vs Arapaho 4 or more Vehicles in Household Correlation Chart
The statistical analysis conducted on geographies consisting of 528,748,745 people shows a strong positive correlation between the proportion of British and percentage of households with 4 or more vehicles available in the United States with a correlation coefficient (R) of 0.708 and weighted average of 7.2%. Similarly, the statistical analysis conducted on geographies consisting of 29,772,761 people shows a weak positive correlation between the proportion of Arapaho and percentage of households with 4 or more vehicles available in the United States with a correlation coefficient (R) of 0.222 and weighted average of 9.4%, a difference of 29.9%.
4 or more Vehicles in Household Correlation Summary
| Measurement | British | Arapaho |
| Minimum | 3.5% | 3.6% |
| Maximum | 100.0% | 28.7% |
| Range | 96.5% | 25.0% |
| Mean | 16.6% | 12.3% |
| Median | 12.7% | 10.7% |
| Interquartile 25% (IQ1) | 10.0% | 7.2% |
| Interquartile 75% (IQ3) | 18.0% | 15.7% |
| Interquartile Range (IQR) | 8.0% | 8.5% |
| Standard Deviation (Sample) | 14.4% | 6.2% |
| Standard Deviation (Population) | 14.2% | 6.1% |
Similar Demographics by 4 or more Vehicles in Household
Demographics Similar to British by 4 or more Vehicles in Household
In terms of 4 or more vehicles in household, the demographic groups most similar to British are Creek (7.2%, a difference of 0.080%), Nonimmigrants (7.2%, a difference of 0.33%), Delaware (7.2%, a difference of 0.35%), Immigrants from Indonesia (7.2%, a difference of 0.41%), and Cree (7.2%, a difference of 0.59%).
| Demographics | Rating | Rank | 4 or more Vehicles in Household |
| Northern Europeans | 99.8 /100 | #82 | Exceptional 7.3% |
| Potawatomi | 99.7 /100 | #83 | Exceptional 7.3% |
| Afghans | 99.7 /100 | #84 | Exceptional 7.3% |
| Cree | 99.7 /100 | #85 | Exceptional 7.2% |
| Immigrants | Indonesia | 99.6 /100 | #86 | Exceptional 7.2% |
| Delaware | 99.6 /100 | #87 | Exceptional 7.2% |
| Immigrants | Nonimmigrants | 99.6 /100 | #88 | Exceptional 7.2% |
| British | 99.6 /100 | #89 | Exceptional 7.2% |
| Creek | 99.6 /100 | #90 | Exceptional 7.2% |
| Assyrians/Chaldeans/Syriacs | 99.4 /100 | #91 | Exceptional 7.2% |
| Immigrants | Latin America | 99.4 /100 | #92 | Exceptional 7.1% |
| Immigrants | Afghanistan | 99.3 /100 | #93 | Exceptional 7.1% |
| Dutch West Indians | 99.3 /100 | #94 | Exceptional 7.1% |
| Czechoslovakians | 99.3 /100 | #95 | Exceptional 7.1% |
| Central Americans | 99.3 /100 | #96 | Exceptional 7.1% |
Demographics Similar to Arapaho by 4 or more Vehicles in Household
In terms of 4 or more vehicles in household, the demographic groups most similar to Arapaho are Native Hawaiian (9.4%, a difference of 0.39%), Puget Sound Salish (9.4%, a difference of 0.41%), Samoan (9.2%, a difference of 1.4%), Immigrants from Fiji (9.6%, a difference of 3.0%), and Paiute (9.0%, a difference of 3.8%).
| Demographics | Rating | Rank | 4 or more Vehicles in Household |
| Yakama | 100 /100 | #1 | Exceptional 12.9% |
| Colville | 100.0 /100 | #2 | Exceptional 11.1% |
| Spanish American Indians | 100.0 /100 | #3 | Exceptional 10.8% |
| Tongans | 100.0 /100 | #4 | Exceptional 10.0% |
| Immigrants | Fiji | 100.0 /100 | #5 | Exceptional 9.6% |
| Puget Sound Salish | 100.0 /100 | #6 | Exceptional 9.4% |
| Native Hawaiians | 100.0 /100 | #7 | Exceptional 9.4% |
| Arapaho | 100.0 /100 | #8 | Exceptional 9.4% |
| Samoans | 100.0 /100 | #9 | Exceptional 9.2% |
| Paiute | 100.0 /100 | #10 | Exceptional 9.0% |
| Immigrants | Mexico | 100.0 /100 | #11 | Exceptional 9.0% |
| Mexicans | 100.0 /100 | #12 | Exceptional 8.9% |
| Hawaiians | 100.0 /100 | #13 | Exceptional 8.9% |
| Chinese | 100.0 /100 | #14 | Exceptional 8.8% |
| Shoshone | 100.0 /100 | #15 | Exceptional 8.8% |