Zip Codes with the Highest Percentage of Population Employed in Firefighting & Prevention in Utah
RELATED REPORTS & OPTIONS
Firefighting & Prevention
Utah
Compare Zip Codes
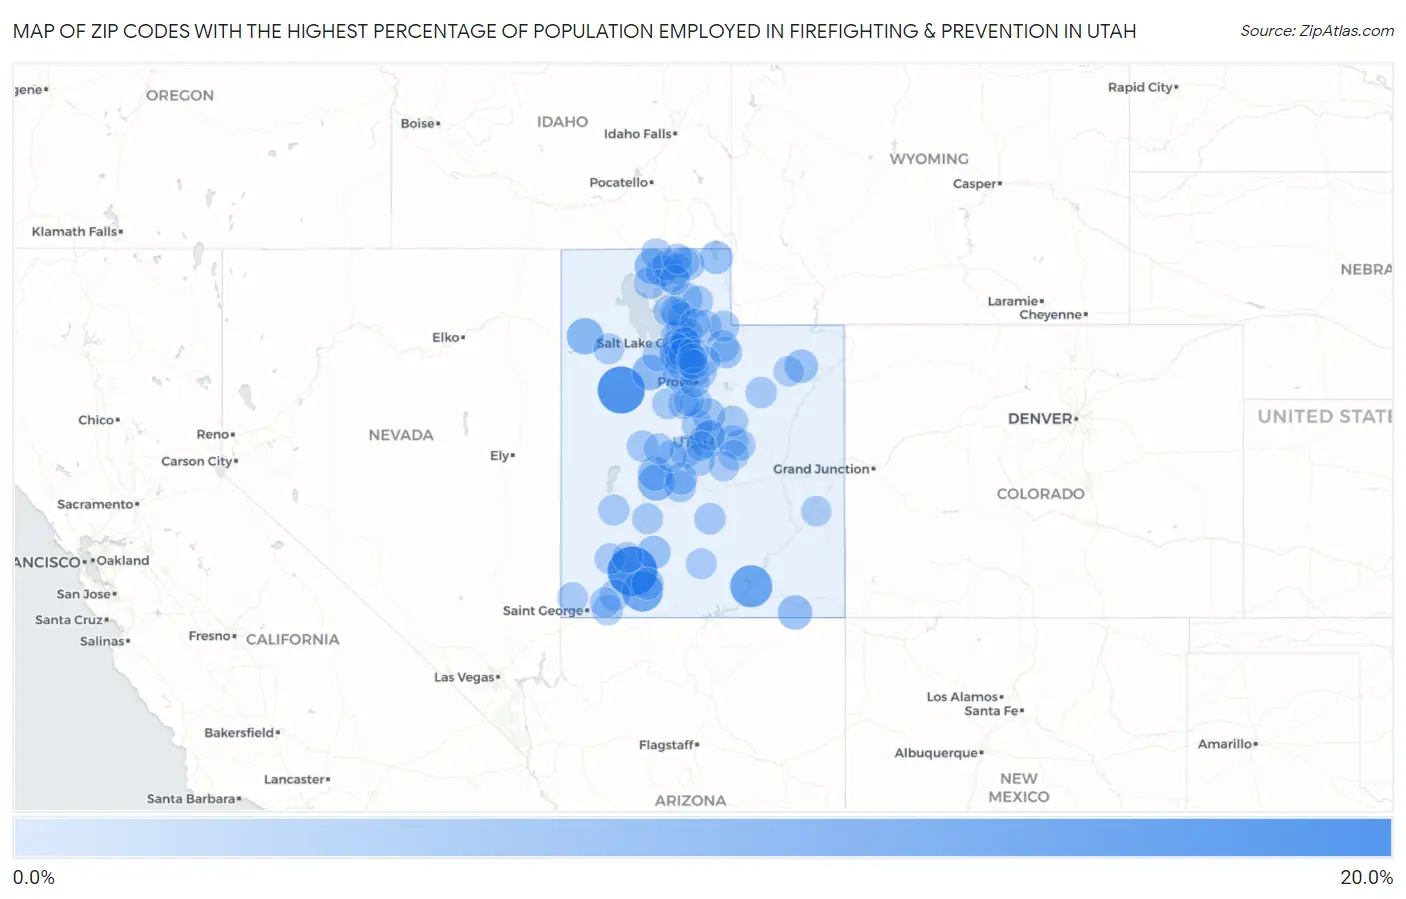
Map of Zip Codes with the Highest Percentage of Population Employed in Firefighting & Prevention in Utah
0.0%
20.0%
Zip Codes with the Highest Percentage of Population Employed in Firefighting & Prevention in Utah
| Zip Code | % Employed | vs State | vs National | |
| 1. | 84719 | 20.0% | 0.95%(+19.1)#1 | 1.2%(+18.8)#94 |
| 2. | 84022 | 17.5% | 0.95%(+16.6)#2 | 1.2%(+16.4)#123 |
| 3. | 84533 | 12.5% | 0.95%(+11.6)#3 | 1.2%(+11.3)#211 |
| 4. | 84729 | 11.2% | 0.95%(+10.2)#4 | 1.2%(+10.00)#258 |
| 5. | 84644 | 6.9% | 0.95%(+5.92)#5 | 1.2%(+5.68)#533 |
| 6. | 84083 | 6.9% | 0.95%(+5.91)#6 | 1.2%(+5.67)#535 |
| 7. | 84069 | 6.0% | 0.95%(+5.10)#7 | 1.2%(+4.86)#666 |
| 8. | 84316 | 6.0% | 0.95%(+5.04)#8 | 1.2%(+4.80)#680 |
| 9. | 84662 | 5.6% | 0.95%(+4.69)#9 | 1.2%(+4.45)#743 |
| 10. | 84531 | 4.9% | 0.95%(+3.95)#10 | 1.2%(+3.71)#948 |
| 11. | 84631 | 4.8% | 0.95%(+3.87)#11 | 1.2%(+3.63)#981 |
| 12. | 84759 | 3.9% | 0.95%(+2.94)#12 | 1.2%(+2.70)#1,414 |
| 13. | 84039 | 3.9% | 0.95%(+2.94)#13 | 1.2%(+2.70)#1,417 |
| 14. | 84038 | 3.6% | 0.95%(+2.63)#14 | 1.2%(+2.39)#1,660 |
| 15. | 84629 | 3.3% | 0.95%(+2.35)#15 | 1.2%(+2.10)#1,909 |
| 16. | 84307 | 3.2% | 0.95%(+2.23)#16 | 1.2%(+1.99)#2,047 |
| 17. | 84630 | 2.9% | 0.95%(+1.96)#17 | 1.2%(+1.72)#2,365 |
| 18. | 84033 | 2.8% | 0.95%(+1.90)#18 | 1.2%(+1.66)#2,473 |
| 19. | 84055 | 2.8% | 0.95%(+1.89)#19 | 1.2%(+1.65)#2,498 |
| 20. | 84310 | 2.8% | 0.95%(+1.88)#20 | 1.2%(+1.64)#2,515 |
| 21. | 84710 | 2.8% | 0.95%(+1.87)#21 | 1.2%(+1.63)#2,536 |
| 22. | 84087 | 2.8% | 0.95%(+1.86)#22 | 1.2%(+1.62)#2,565 |
| 23. | 84314 | 2.7% | 0.95%(+1.79)#23 | 1.2%(+1.55)#2,673 |
| 24. | 84642 | 2.6% | 0.95%(+1.67)#24 | 1.2%(+1.43)#2,856 |
| 25. | 84318 | 2.6% | 0.95%(+1.64)#25 | 1.2%(+1.40)#2,933 |
| 26. | 84657 | 2.5% | 0.95%(+1.59)#26 | 1.2%(+1.35)#3,022 |
| 27. | 84620 | 2.4% | 0.95%(+1.44)#27 | 1.2%(+1.20)#3,381 |
| 28. | 84528 | 2.3% | 0.95%(+1.35)#28 | 1.2%(+1.11)#3,568 |
| 29. | 84036 | 2.3% | 0.95%(+1.34)#29 | 1.2%(+1.10)#3,599 |
| 30. | 84632 | 2.0% | 0.95%(+1.09)#30 | 1.2%(+0.849)#4,386 |
| 31. | 84656 | 2.0% | 0.95%(+1.05)#31 | 1.2%(+0.804)#4,538 |
| 32. | 84337 | 2.0% | 0.95%(+1.04)#32 | 1.2%(+0.802)#4,546 |
| 33. | 84749 | 2.0% | 0.95%(+1.04)#33 | 1.2%(+0.794)#4,593 |
| 34. | 84107 | 2.0% | 0.95%(+1.02)#34 | 1.2%(+0.783)#4,632 |
| 35. | 84624 | 1.9% | 0.95%(+0.996)#35 | 1.2%(+0.755)#4,740 |
| 36. | 84021 | 1.8% | 0.95%(+0.890)#36 | 1.2%(+0.649)#5,198 |
| 37. | 84094 | 1.8% | 0.95%(+0.853)#37 | 1.2%(+0.612)#5,368 |
| 38. | 84335 | 1.7% | 0.95%(+0.799)#38 | 1.2%(+0.559)#5,607 |
| 39. | 84518 | 1.7% | 0.95%(+0.797)#39 | 1.2%(+0.556)#5,618 |
| 40. | 84651 | 1.7% | 0.95%(+0.746)#40 | 1.2%(+0.506)#5,881 |
| 41. | 84317 | 1.7% | 0.95%(+0.735)#41 | 1.2%(+0.494)#5,946 |
| 42. | 84017 | 1.7% | 0.95%(+0.725)#42 | 1.2%(+0.485)#5,996 |
| 43. | 84751 | 1.6% | 0.95%(+0.683)#43 | 1.2%(+0.442)#6,237 |
| 44. | 84056 | 1.6% | 0.95%(+0.631)#44 | 1.2%(+0.390)#6,509 |
| 45. | 84010 | 1.6% | 0.95%(+0.626)#45 | 1.2%(+0.385)#6,541 |
| 46. | 84526 | 1.6% | 0.95%(+0.605)#46 | 1.2%(+0.365)#6,652 |
| 47. | 84633 | 1.5% | 0.95%(+0.600)#47 | 1.2%(+0.359)#6,682 |
| 48. | 84084 | 1.5% | 0.95%(+0.591)#48 | 1.2%(+0.351)#6,735 |
| 49. | 84093 | 1.5% | 0.95%(+0.588)#49 | 1.2%(+0.347)#6,758 |
| 50. | 84713 | 1.5% | 0.95%(+0.583)#50 | 1.2%(+0.342)#6,794 |
| 51. | 84315 | 1.5% | 0.95%(+0.559)#51 | 1.2%(+0.318)#6,936 |
| 52. | 84628 | 1.5% | 0.95%(+0.543)#52 | 1.2%(+0.302)#7,057 |
| 53. | 84312 | 1.5% | 0.95%(+0.526)#53 | 1.2%(+0.285)#7,164 |
| 54. | 84779 | 1.4% | 0.95%(+0.504)#54 | 1.2%(+0.263)#7,317 |
| 55. | 84721 | 1.4% | 0.95%(+0.484)#55 | 1.2%(+0.243)#7,443 |
| 56. | 84737 | 1.4% | 0.95%(+0.464)#56 | 1.2%(+0.223)#7,578 |
| 57. | 84029 | 1.4% | 0.95%(+0.433)#57 | 1.2%(+0.192)#7,790 |
| 58. | 84649 | 1.3% | 0.95%(+0.402)#58 | 1.2%(+0.161)#8,006 |
| 59. | 84761 | 1.3% | 0.95%(+0.400)#59 | 1.2%(+0.160)#8,023 |
| 60. | 84117 | 1.3% | 0.95%(+0.379)#60 | 1.2%(+0.138)#8,165 |
| 61. | 84726 | 1.3% | 0.95%(+0.378)#61 | 1.2%(+0.137)#8,173 |
| 62. | 84604 | 1.3% | 0.95%(+0.377)#62 | 1.2%(+0.136)#8,186 |
| 63. | 84116 | 1.3% | 0.95%(+0.339)#63 | 1.2%(+0.098)#8,470 |
| 64. | 84118 | 1.3% | 0.95%(+0.323)#64 | 1.2%(+0.083)#8,601 |
| 65. | 84081 | 1.3% | 0.95%(+0.318)#65 | 1.2%(+0.077)#8,636 |
| 66. | 84009 | 1.3% | 0.95%(+0.306)#66 | 1.2%(+0.066)#8,742 |
| 67. | 84045 | 1.2% | 0.95%(+0.300)#67 | 1.2%(+0.060)#8,771 |
| 68. | 84111 | 1.2% | 0.95%(+0.299)#68 | 1.2%(+0.058)#8,784 |
| 69. | 84647 | 1.2% | 0.95%(+0.297)#69 | 1.2%(+0.056)#8,805 |
| 70. | 84331 | 1.2% | 0.95%(+0.274)#70 | 1.2%(+0.034)#8,993 |
| 71. | 84005 | 1.2% | 0.95%(+0.270)#71 | 1.2%(+0.030)#9,015 |
| 72. | 84745 | 1.2% | 0.95%(+0.246)#72 | 1.2%(+0.005)#9,217 |
| 73. | 84765 | 1.2% | 0.95%(+0.240)#73 | 1.2%(-0.001)#9,272 |
| 74. | 84129 | 1.2% | 0.95%(+0.238)#74 | 1.2%(-0.002)#9,286 |
| 75. | 84074 | 1.2% | 0.95%(+0.211)#75 | 1.2%(-0.030)#9,552 |
| 76. | 84065 | 1.1% | 0.95%(+0.198)#76 | 1.2%(-0.043)#9,687 |
| 77. | 84325 | 1.1% | 0.95%(+0.182)#77 | 1.2%(-0.059)#9,850 |
| 78. | 84062 | 1.1% | 0.95%(+0.173)#78 | 1.2%(-0.068)#9,934 |
| 79. | 84104 | 1.1% | 0.95%(+0.167)#79 | 1.2%(-0.074)#9,996 |
| 80. | 84088 | 1.1% | 0.95%(+0.157)#80 | 1.2%(-0.084)#10,087 |
| 81. | 84066 | 1.1% | 0.95%(+0.145)#81 | 1.2%(-0.096)#10,192 |
| 82. | 84112 | 1.1% | 0.95%(+0.117)#82 | 1.2%(-0.123)#10,453 |
| 83. | 84102 | 1.1% | 0.95%(+0.107)#83 | 1.2%(-0.134)#10,588 |
| 84. | 84655 | 1.1% | 0.95%(+0.106)#84 | 1.2%(-0.134)#10,589 |
| 85. | 84047 | 1.0% | 0.95%(+0.094)#85 | 1.2%(-0.147)#10,697 |
| 86. | 84040 | 1.0% | 0.95%(+0.090)#86 | 1.2%(-0.151)#10,726 |
| 87. | 84049 | 1.0% | 0.95%(+0.060)#87 | 1.2%(-0.181)#11,045 |
| 88. | 84121 | 1.0% | 0.95%(+0.060)#88 | 1.2%(-0.181)#11,048 |
| 89. | 84601 | 0.98% | 0.95%(+0.038)#89 | 1.2%(-0.203)#11,262 |
| 90. | 84004 | 0.97% | 0.95%(+0.021)#90 | 1.2%(-0.220)#11,462 |
| 91. | 84627 | 0.96% | 0.95%(+0.014)#91 | 1.2%(-0.227)#11,552 |
| 92. | 84513 | 0.96% | 0.95%(+0.012)#92 | 1.2%(-0.229)#11,571 |
| 93. | 84302 | 0.95% | 0.95%(+0.007)#93 | 1.2%(-0.234)#11,629 |
| 94. | 84003 | 0.95% | 0.95%(+0.005)#94 | 1.2%(-0.236)#11,644 |
| 95. | 84067 | 0.95% | 0.95%(+0.001)#95 | 1.2%(-0.240)#11,684 |
| 96. | 84050 | 0.94% | 0.95%(-0.002)#96 | 1.2%(-0.243)#11,714 |
| 97. | 84523 | 0.94% | 0.95%(-0.006)#97 | 1.2%(-0.247)#11,750 |
| 98. | 84092 | 0.93% | 0.95%(-0.015)#98 | 1.2%(-0.256)#11,838 |
| 99. | 84532 | 0.92% | 0.95%(-0.024)#99 | 1.2%(-0.264)#11,929 |
| 100. | 84327 | 0.92% | 0.95%(-0.030)#100 | 1.2%(-0.270)#11,988 |
Common Questions
What are the Top 10 Zip Codes with the Highest Percentage of Population Employed in Firefighting & Prevention in Utah?
Top 10 Zip Codes with the Highest Percentage of Population Employed in Firefighting & Prevention in Utah are:
What zip code has the Highest Percentage of Population Employed in Firefighting & Prevention in Utah?
84719 has the Highest Percentage of Population Employed in Firefighting & Prevention in Utah with 20.0%.
What is the Percentage of Population Employed in Firefighting & Prevention in the State of Utah?
Percentage of Population Employed in Firefighting & Prevention in Utah is 0.95%.
What is the Percentage of Population Employed in Firefighting & Prevention in the United States?
Percentage of Population Employed in Firefighting & Prevention in the United States is 1.2%.