Zip Codes with the Highest Percentage of Scotch-Irish Population in Utah
RELATED REPORTS & OPTIONS
Scotch-Irish
Utah
Compare Zip Codes
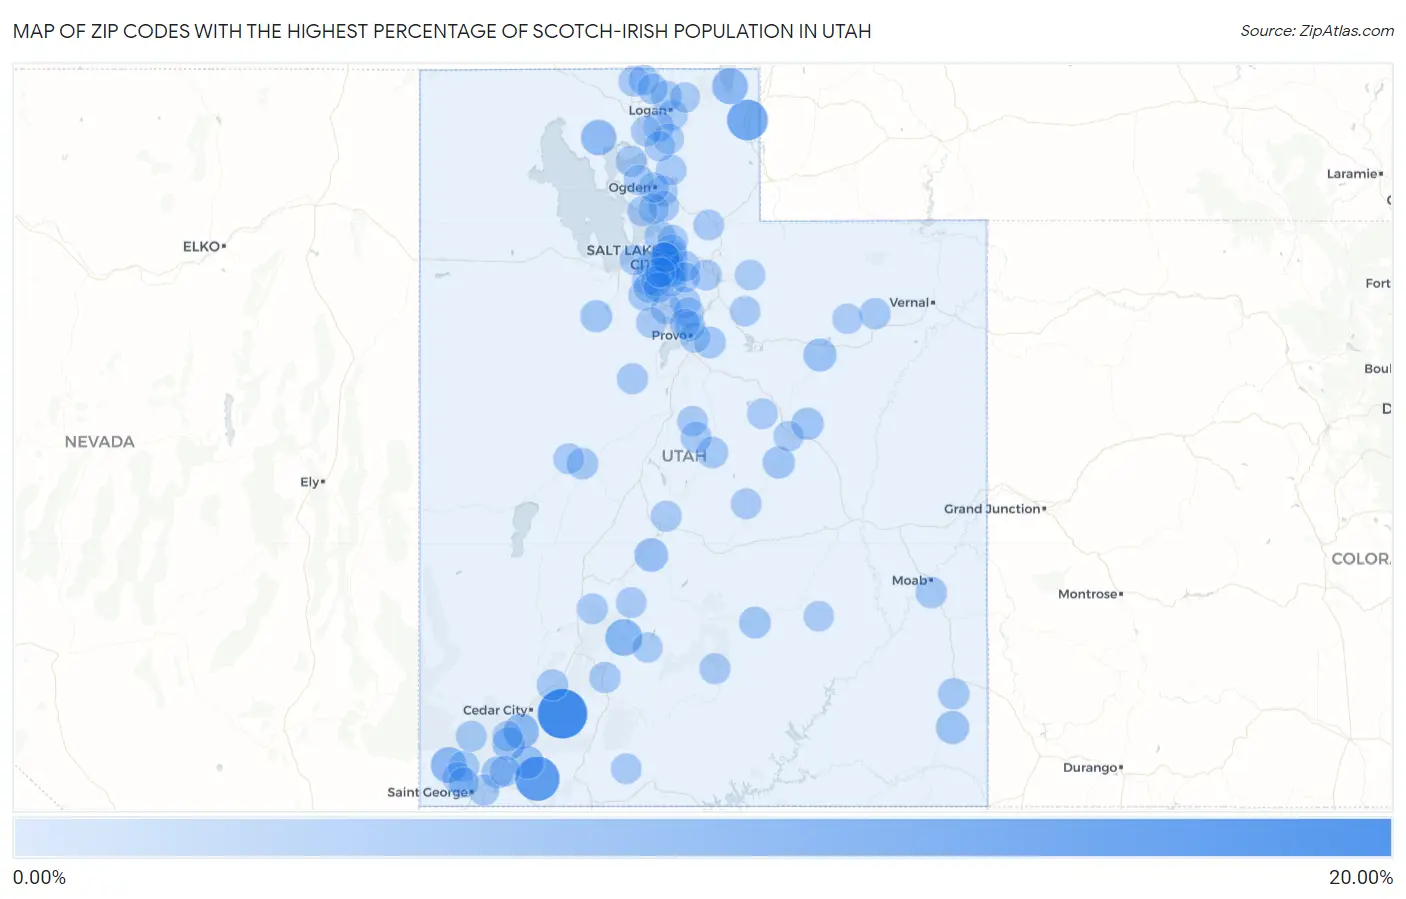
Map of Zip Codes with the Highest Percentage of Scotch-Irish Population in Utah
0.00%
20.00%
Zip Codes with the Highest Percentage of Scotch-Irish Population in Utah
| Zip Code | Scotch-Irish | vs State | vs National | |
| 1. | 84719 | 18.33% | 0.79%(+17.5)#1 | 0.82%(+17.5)#67 |
| 2. | 84767 | 13.36% | 0.79%(+12.6)#2 | 0.82%(+12.5)#125 |
| 3. | 84064 | 10.18% | 0.79%(+9.38)#3 | 0.82%(+9.36)#209 |
| 4. | 84723 | 6.50% | 0.79%(+5.70)#4 | 0.82%(+5.68)#482 |
| 5. | 84038 | 5.73% | 0.79%(+4.94)#5 | 0.82%(+4.91)#603 |
| 6. | 84733 | 5.58% | 0.79%(+4.78)#6 | 0.82%(+4.76)#632 |
| 7. | 84742 | 5.19% | 0.79%(+4.39)#7 | 0.82%(+4.37)#716 |
| 8. | 84307 | 5.18% | 0.79%(+4.39)#8 | 0.82%(+4.36)#718 |
| 9. | 84730 | 3.70% | 0.79%(+2.91)#9 | 0.82%(+2.89)#1,302 |
| 10. | 84511 | 3.36% | 0.79%(+2.57)#10 | 0.82%(+2.55)#1,565 |
| 11. | 84021 | 3.24% | 0.79%(+2.45)#11 | 0.82%(+2.42)#1,686 |
| 12. | 84779 | 3.18% | 0.79%(+2.38)#12 | 0.82%(+2.36)#1,748 |
| 13. | 84757 | 3.14% | 0.79%(+2.35)#13 | 0.82%(+2.32)#1,795 |
| 14. | 84542 | 2.59% | 0.79%(+1.80)#14 | 0.82%(+1.77)#2,514 |
| 15. | 84518 | 2.40% | 0.79%(+1.60)#15 | 0.82%(+1.58)#2,839 |
| 16. | 84113 | 2.32% | 0.79%(+1.52)#16 | 0.82%(+1.50)#3,003 |
| 17. | 84069 | 2.29% | 0.79%(+1.49)#17 | 0.82%(+1.47)#3,057 |
| 18. | 84746 | 2.12% | 0.79%(+1.33)#18 | 0.82%(+1.30)#3,460 |
| 19. | 84775 | 1.99% | 0.79%(+1.19)#19 | 0.82%(+1.17)#3,864 |
| 20. | 84663 | 1.88% | 0.79%(+1.08)#20 | 0.82%(+1.06)#4,245 |
| 21. | 84624 | 1.80% | 0.79%(+1.01)#21 | 0.82%(+0.984)#4,502 |
| 22. | 84535 | 1.77% | 0.79%(+0.973)#22 | 0.82%(+0.950)#4,629 |
| 23. | 84532 | 1.77% | 0.79%(+0.971)#23 | 0.82%(+0.948)#4,636 |
| 24. | 84761 | 1.76% | 0.79%(+0.965)#24 | 0.82%(+0.942)#4,664 |
| 25. | 84662 | 1.69% | 0.79%(+0.899)#25 | 0.82%(+0.876)#4,939 |
| 26. | 84087 | 1.53% | 0.79%(+0.738)#26 | 0.82%(+0.714)#5,749 |
| 27. | 84124 | 1.51% | 0.79%(+0.719)#27 | 0.82%(+0.696)#5,849 |
| 28. | 84759 | 1.50% | 0.79%(+0.706)#28 | 0.82%(+0.683)#5,920 |
| 29. | 84103 | 1.49% | 0.79%(+0.691)#29 | 0.82%(+0.668)#6,013 |
| 30. | 84783 | 1.48% | 0.79%(+0.690)#30 | 0.82%(+0.667)#6,023 |
| 31. | 84335 | 1.46% | 0.79%(+0.669)#31 | 0.82%(+0.645)#6,141 |
| 32. | 84066 | 1.46% | 0.79%(+0.665)#32 | 0.82%(+0.642)#6,156 |
| 33. | 84117 | 1.46% | 0.79%(+0.664)#33 | 0.82%(+0.641)#6,163 |
| 34. | 84780 | 1.40% | 0.79%(+0.609)#34 | 0.82%(+0.586)#6,490 |
| 35. | 84628 | 1.40% | 0.79%(+0.608)#35 | 0.82%(+0.585)#6,500 |
| 36. | 84106 | 1.39% | 0.79%(+0.600)#36 | 0.82%(+0.577)#6,548 |
| 37. | 84340 | 1.39% | 0.79%(+0.599)#37 | 0.82%(+0.576)#6,557 |
| 38. | 84096 | 1.39% | 0.79%(+0.594)#38 | 0.82%(+0.571)#6,579 |
| 39. | 84105 | 1.38% | 0.79%(+0.583)#39 | 0.82%(+0.560)#6,667 |
| 40. | 84646 | 1.36% | 0.79%(+0.570)#40 | 0.82%(+0.546)#6,755 |
| 41. | 84716 | 1.28% | 0.79%(+0.490)#41 | 0.82%(+0.467)#7,322 |
| 42. | 84060 | 1.25% | 0.79%(+0.459)#42 | 0.82%(+0.436)#7,535 |
| 43. | 84081 | 1.25% | 0.79%(+0.455)#43 | 0.82%(+0.432)#7,576 |
| 44. | 84652 | 1.25% | 0.79%(+0.452)#44 | 0.82%(+0.428)#7,599 |
| 45. | 84722 | 1.22% | 0.79%(+0.425)#45 | 0.82%(+0.402)#7,795 |
| 46. | 84738 | 1.22% | 0.79%(+0.423)#46 | 0.82%(+0.400)#7,807 |
| 47. | 84033 | 1.14% | 0.79%(+0.347)#47 | 0.82%(+0.324)#8,384 |
| 48. | 84009 | 1.11% | 0.79%(+0.318)#48 | 0.82%(+0.295)#8,639 |
| 49. | 84635 | 1.10% | 0.79%(+0.310)#49 | 0.82%(+0.287)#8,703 |
| 50. | 84043 | 1.08% | 0.79%(+0.285)#50 | 0.82%(+0.261)#8,935 |
| 51. | 84330 | 1.08% | 0.79%(+0.284)#51 | 0.82%(+0.260)#8,947 |
| 52. | 84003 | 1.08% | 0.79%(+0.283)#52 | 0.82%(+0.260)#8,950 |
| 53. | 84305 | 1.06% | 0.79%(+0.268)#53 | 0.82%(+0.244)#9,099 |
| 54. | 84632 | 1.06% | 0.79%(+0.265)#54 | 0.82%(+0.241)#9,122 |
| 55. | 84526 | 1.06% | 0.79%(+0.262)#55 | 0.82%(+0.239)#9,139 |
| 56. | 84741 | 1.05% | 0.79%(+0.254)#56 | 0.82%(+0.230)#9,230 |
| 57. | 84713 | 1.05% | 0.79%(+0.252)#57 | 0.82%(+0.229)#9,244 |
| 58. | 84523 | 1.03% | 0.79%(+0.240)#58 | 0.82%(+0.217)#9,381 |
| 59. | 84750 | 1.03% | 0.79%(+0.231)#59 | 0.82%(+0.208)#9,472 |
| 60. | 84102 | 1.02% | 0.79%(+0.223)#60 | 0.82%(+0.200)#9,568 |
| 61. | 84403 | 1.01% | 0.79%(+0.217)#61 | 0.82%(+0.193)#9,628 |
| 62. | 84040 | 1.01% | 0.79%(+0.212)#62 | 0.82%(+0.189)#9,682 |
| 63. | 84774 | 0.98% | 0.79%(+0.189)#63 | 0.82%(+0.165)#9,921 |
| 64. | 84310 | 0.98% | 0.79%(+0.181)#64 | 0.82%(+0.157)#10,012 |
| 65. | 84332 | 0.97% | 0.79%(+0.180)#65 | 0.82%(+0.156)#10,025 |
| 66. | 84339 | 0.96% | 0.79%(+0.169)#66 | 0.82%(+0.146)#10,137 |
| 67. | 84120 | 0.96% | 0.79%(+0.167)#67 | 0.82%(+0.143)#10,164 |
| 68. | 84327 | 0.96% | 0.79%(+0.166)#68 | 0.82%(+0.143)#10,171 |
| 69. | 84005 | 0.95% | 0.79%(+0.159)#69 | 0.82%(+0.135)#10,236 |
| 70. | 84010 | 0.95% | 0.79%(+0.152)#70 | 0.82%(+0.128)#10,310 |
| 71. | 84101 | 0.94% | 0.79%(+0.143)#71 | 0.82%(+0.120)#10,405 |
| 72. | 84328 | 0.93% | 0.79%(+0.137)#72 | 0.82%(+0.113)#10,475 |
| 73. | 84093 | 0.92% | 0.79%(+0.129)#73 | 0.82%(+0.106)#10,553 |
| 74. | 84109 | 0.92% | 0.79%(+0.126)#74 | 0.82%(+0.103)#10,594 |
| 75. | 84032 | 0.91% | 0.79%(+0.115)#75 | 0.82%(+0.091)#10,726 |
| 76. | 84062 | 0.91% | 0.79%(+0.112)#76 | 0.82%(+0.089)#10,754 |
| 77. | 84036 | 0.90% | 0.79%(+0.109)#77 | 0.82%(+0.086)#10,797 |
| 78. | 84734 | 0.90% | 0.79%(+0.102)#78 | 0.82%(+0.079)#10,871 |
| 79. | 84324 | 0.89% | 0.79%(+0.096)#79 | 0.82%(+0.072)#10,942 |
| 80. | 84107 | 0.87% | 0.79%(+0.080)#80 | 0.82%(+0.057)#11,117 |
| 81. | 84001 | 0.87% | 0.79%(+0.071)#81 | 0.82%(+0.048)#11,232 |
| 82. | 84606 | 0.86% | 0.79%(+0.063)#82 | 0.82%(+0.040)#11,320 |
| 83. | 84302 | 0.84% | 0.79%(+0.044)#83 | 0.82%(+0.020)#11,565 |
| 84. | 84041 | 0.84% | 0.79%(+0.042)#84 | 0.82%(+0.018)#11,590 |
| 85. | 84121 | 0.83% | 0.79%(+0.038)#85 | 0.82%(+0.015)#11,637 |
| 86. | 84044 | 0.83% | 0.79%(+0.032)#86 | 0.82%(+0.009)#11,711 |
| 87. | 84712 | 0.83% | 0.79%(+0.032)#87 | 0.82%(+0.009)#11,716 |
| 88. | 84088 | 0.82% | 0.79%(+0.023)#88 | 0.82%(-0.001)#11,839 |
| 89. | 84097 | 0.81% | 0.79%(+0.018)#89 | 0.82%(-0.005)#11,901 |
| 90. | 84770 | 0.81% | 0.79%(+0.015)#90 | 0.82%(-0.009)#11,940 |
| 91. | 84075 | 0.80% | 0.79%(+0.006)#91 | 0.82%(-0.018)#12,067 |
| 92. | 84111 | 0.78% | 0.79%(-0.011)#92 | 0.82%(-0.034)#12,265 |
| 93. | 84501 | 0.78% | 0.79%(-0.012)#93 | 0.82%(-0.036)#12,289 |
| 94. | 84057 | 0.77% | 0.79%(-0.025)#94 | 0.82%(-0.049)#12,438 |
| 95. | 84095 | 0.77% | 0.79%(-0.026)#95 | 0.82%(-0.049)#12,443 |
| 96. | 84123 | 0.76% | 0.79%(-0.038)#96 | 0.82%(-0.061)#12,617 |
| 97. | 84401 | 0.75% | 0.79%(-0.049)#97 | 0.82%(-0.072)#12,765 |
| 98. | 84404 | 0.74% | 0.79%(-0.055)#98 | 0.82%(-0.078)#12,829 |
| 99. | 84321 | 0.73% | 0.79%(-0.064)#99 | 0.82%(-0.088)#12,969 |
| 100. | 84720 | 0.73% | 0.79%(-0.067)#100 | 0.82%(-0.091)#13,029 |
Common Questions
What are the Top 10 Zip Codes with the Highest Percentage of Scotch-Irish Population in Utah?
Top 10 Zip Codes with the Highest Percentage of Scotch-Irish Population in Utah are:
What zip code has the Highest Percentage of Scotch-Irish Population in Utah?
84719 has the Highest Percentage of Scotch-Irish Population in Utah with 18.33%.
What is the Percentage of Scotch-Irish Population in the State of Utah?
Percentage of Scotch-Irish Population in Utah is 0.79%.
What is the Percentage of Scotch-Irish Population in the United States?
Percentage of Scotch-Irish Population in the United States is 0.82%.