Zip Codes with the Highest Percentage of Population Employed in Farming, Fishing & Forestry in Utah
RELATED REPORTS & OPTIONS
Farming, Fishing & Forestry
Utah
Compare Zip Codes
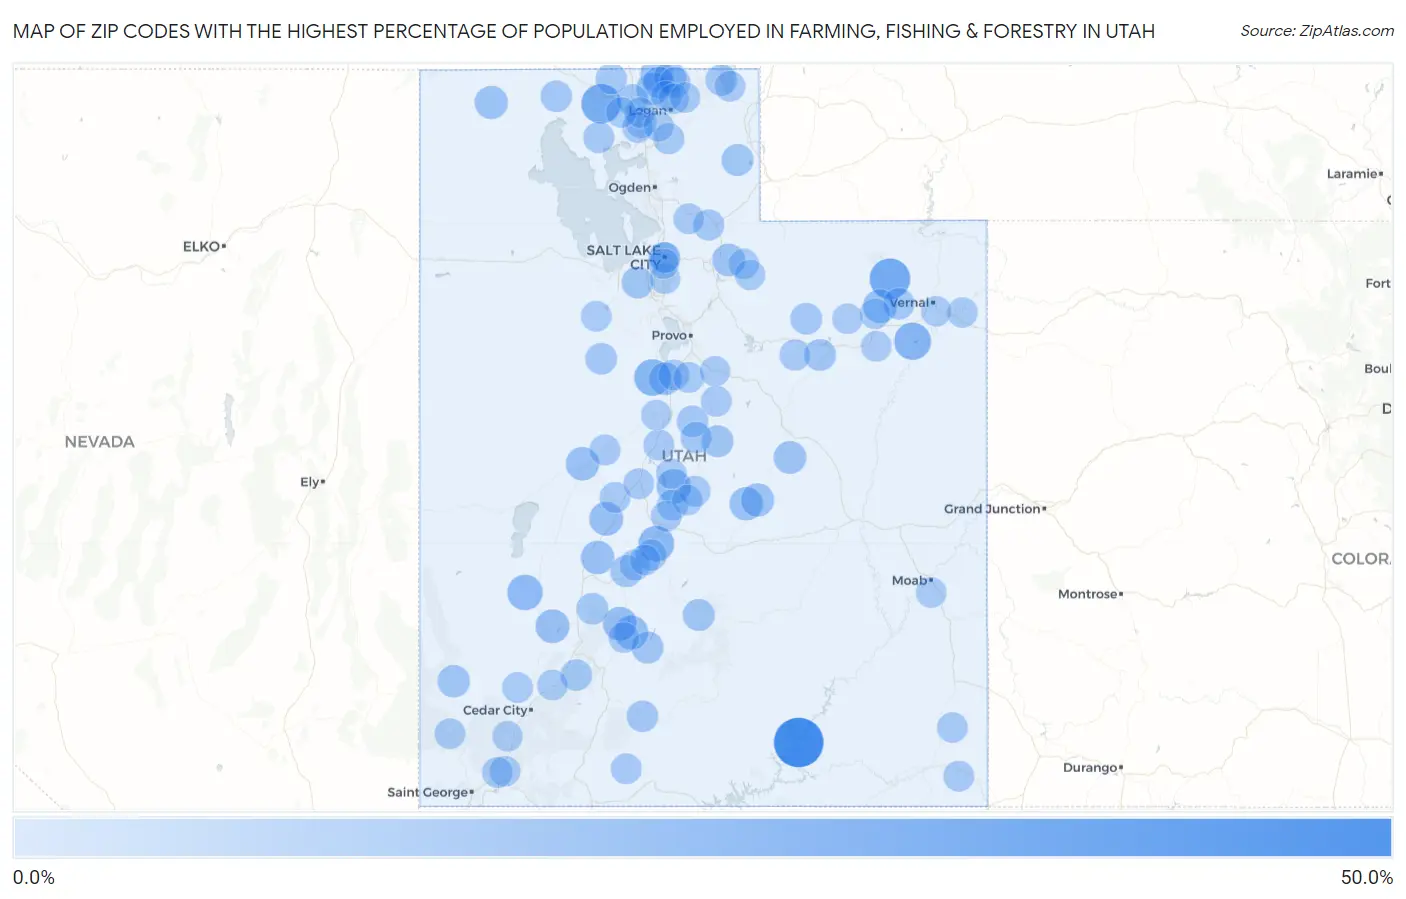
Map of Zip Codes with the Highest Percentage of Population Employed in Farming, Fishing & Forestry in Utah
0.0%
50.0%
Zip Codes with the Highest Percentage of Population Employed in Farming, Fishing & Forestry in Utah
| Zip Code | % Employed | vs State | vs National | |
| 1. | 84533 | 50.0% | 0.32%(+49.7)#1 | 0.61%(+49.4)#56 |
| 2. | 84085 | 26.5% | 0.32%(+26.1)#2 | 0.61%(+25.9)#252 |
| 3. | 84316 | 24.0% | 0.32%(+23.6)#3 | 0.61%(+23.3)#304 |
| 4. | 84063 | 17.2% | 0.32%(+16.9)#4 | 0.61%(+16.6)#520 |
| 5. | 84626 | 16.1% | 0.32%(+15.8)#5 | 0.61%(+15.5)#585 |
| 6. | 84657 | 14.1% | 0.32%(+13.8)#6 | 0.61%(+13.5)#706 |
| 7. | 84751 | 13.3% | 0.32%(+13.0)#7 | 0.61%(+12.7)#786 |
| 8. | 84634 | 10.3% | 0.32%(+10.0)#8 | 0.61%(+9.74)#1,153 |
| 9. | 84743 | 9.3% | 0.32%(+9.02)#9 | 0.61%(+8.74)#1,330 |
| 10. | 84053 | 9.3% | 0.32%(+8.98)#10 | 0.61%(+8.70)#1,340 |
| 11. | 84740 | 9.3% | 0.32%(+8.94)#11 | 0.61%(+8.65)#1,347 |
| 12. | 84631 | 9.2% | 0.32%(+8.86)#12 | 0.61%(+8.58)#1,363 |
| 13. | 84752 | 9.0% | 0.32%(+8.67)#13 | 0.61%(+8.38)#1,407 |
| 14. | 84624 | 8.2% | 0.32%(+7.90)#14 | 0.61%(+7.62)#1,595 |
| 15. | 84523 | 8.1% | 0.32%(+7.81)#15 | 0.61%(+7.53)#1,624 |
| 16. | 84637 | 8.0% | 0.32%(+7.72)#16 | 0.61%(+7.43)#1,652 |
| 17. | 84516 | 7.7% | 0.32%(+7.37)#17 | 0.61%(+7.09)#1,764 |
| 18. | 84329 | 7.6% | 0.32%(+7.30)#18 | 0.61%(+7.02)#1,783 |
| 19. | 84308 | 6.6% | 0.32%(+6.25)#19 | 0.61%(+5.96)#2,136 |
| 20. | 84633 | 6.4% | 0.32%(+6.08)#20 | 0.61%(+5.80)#2,198 |
| 21. | 84521 | 6.3% | 0.32%(+5.96)#21 | 0.61%(+5.68)#2,246 |
| 22. | 84061 | 6.3% | 0.32%(+5.96)#22 | 0.61%(+5.67)#2,253 |
| 23. | 84327 | 6.2% | 0.32%(+5.86)#23 | 0.61%(+5.57)#2,301 |
| 24. | 84714 | 5.5% | 0.32%(+5.13)#24 | 0.61%(+4.85)#2,675 |
| 25. | 84320 | 5.0% | 0.32%(+4.71)#25 | 0.61%(+4.43)#2,904 |
| 26. | 84712 | 4.7% | 0.32%(+4.33)#26 | 0.61%(+4.05)#3,190 |
| 27. | 84086 | 4.5% | 0.32%(+4.14)#27 | 0.61%(+3.85)#3,339 |
| 28. | 84715 | 4.3% | 0.32%(+3.99)#28 | 0.61%(+3.71)#3,443 |
| 29. | 84647 | 4.3% | 0.32%(+3.97)#29 | 0.61%(+3.69)#3,460 |
| 30. | 84021 | 4.2% | 0.32%(+3.88)#30 | 0.61%(+3.60)#3,543 |
| 31. | 84739 | 4.2% | 0.32%(+3.86)#31 | 0.61%(+3.57)#3,559 |
| 32. | 84006 | 4.1% | 0.32%(+3.76)#32 | 0.61%(+3.48)#3,646 |
| 33. | 84338 | 3.7% | 0.32%(+3.34)#33 | 0.61%(+3.06)#4,035 |
| 34. | 84076 | 3.6% | 0.32%(+3.31)#34 | 0.61%(+3.03)#4,063 |
| 35. | 84072 | 3.6% | 0.32%(+3.29)#35 | 0.61%(+3.01)#4,080 |
| 36. | 84080 | 3.6% | 0.32%(+3.29)#36 | 0.61%(+3.01)#4,081 |
| 37. | 84760 | 3.4% | 0.32%(+3.08)#37 | 0.61%(+2.80)#4,329 |
| 38. | 84713 | 3.4% | 0.32%(+3.04)#38 | 0.61%(+2.76)#4,381 |
| 39. | 84632 | 3.3% | 0.32%(+2.93)#39 | 0.61%(+2.65)#4,486 |
| 40. | 84336 | 3.3% | 0.32%(+2.93)#40 | 0.61%(+2.65)#4,491 |
| 41. | 84312 | 3.2% | 0.32%(+2.89)#41 | 0.61%(+2.60)#4,538 |
| 42. | 84776 | 3.2% | 0.32%(+2.85)#42 | 0.61%(+2.57)#4,587 |
| 43. | 84646 | 3.0% | 0.32%(+2.71)#43 | 0.61%(+2.43)#4,760 |
| 44. | 84028 | 2.9% | 0.32%(+2.62)#44 | 0.61%(+2.34)#4,901 |
| 45. | 84730 | 2.6% | 0.32%(+2.30)#45 | 0.61%(+2.02)#5,351 |
| 46. | 84331 | 2.4% | 0.32%(+2.12)#46 | 0.61%(+1.83)#5,653 |
| 47. | 84307 | 2.3% | 0.32%(+1.97)#47 | 0.61%(+1.69)#5,930 |
| 48. | 84033 | 2.3% | 0.32%(+1.95)#48 | 0.61%(+1.67)#5,969 |
| 49. | 84328 | 2.2% | 0.32%(+1.83)#49 | 0.61%(+1.55)#6,224 |
| 50. | 84622 | 2.0% | 0.32%(+1.70)#50 | 0.61%(+1.42)#6,488 |
| 51. | 84724 | 1.9% | 0.32%(+1.57)#51 | 0.61%(+1.29)#6,785 |
| 52. | 84027 | 1.9% | 0.32%(+1.56)#52 | 0.61%(+1.28)#6,805 |
| 53. | 84642 | 1.9% | 0.32%(+1.54)#53 | 0.61%(+1.26)#6,866 |
| 54. | 84639 | 1.8% | 0.32%(+1.47)#54 | 0.61%(+1.19)#7,043 |
| 55. | 84640 | 1.7% | 0.32%(+1.37)#55 | 0.61%(+1.09)#7,315 |
| 56. | 84314 | 1.6% | 0.32%(+1.32)#56 | 0.61%(+1.03)#7,465 |
| 57. | 84774 | 1.6% | 0.32%(+1.31)#57 | 0.61%(+1.03)#7,483 |
| 58. | 84629 | 1.6% | 0.32%(+1.29)#58 | 0.61%(+1.01)#7,544 |
| 59. | 84746 | 1.6% | 0.32%(+1.28)#59 | 0.61%(+0.999)#7,572 |
| 60. | 84741 | 1.6% | 0.32%(+1.27)#60 | 0.61%(+0.991)#7,594 |
| 61. | 84636 | 1.6% | 0.32%(+1.26)#61 | 0.61%(+0.982)#7,626 |
| 62. | 84656 | 1.5% | 0.32%(+1.17)#62 | 0.61%(+0.887)#7,907 |
| 63. | 84050 | 1.5% | 0.32%(+1.17)#63 | 0.61%(+0.884)#7,913 |
| 64. | 84534 | 1.5% | 0.32%(+1.16)#64 | 0.61%(+0.875)#7,942 |
| 65. | 84333 | 1.5% | 0.32%(+1.15)#65 | 0.61%(+0.865)#7,966 |
| 66. | 84101 | 1.4% | 0.32%(+1.10)#66 | 0.61%(+0.819)#8,118 |
| 67. | 84655 | 1.4% | 0.32%(+1.10)#67 | 0.61%(+0.815)#8,137 |
| 68. | 84301 | 1.3% | 0.32%(+1.02)#68 | 0.61%(+0.742)#8,389 |
| 69. | 84651 | 1.3% | 0.32%(+1.01)#69 | 0.61%(+0.722)#8,460 |
| 70. | 84652 | 1.3% | 0.32%(+0.965)#70 | 0.61%(+0.682)#8,613 |
| 71. | 84723 | 1.3% | 0.32%(+0.935)#71 | 0.61%(+0.652)#8,733 |
| 72. | 84721 | 1.2% | 0.32%(+0.917)#72 | 0.61%(+0.634)#8,798 |
| 73. | 84335 | 1.2% | 0.32%(+0.874)#73 | 0.61%(+0.591)#8,941 |
| 74. | 84038 | 1.2% | 0.32%(+0.868)#74 | 0.61%(+0.585)#8,967 |
| 75. | 84761 | 1.2% | 0.32%(+0.843)#75 | 0.61%(+0.560)#9,056 |
| 76. | 84511 | 1.2% | 0.32%(+0.836)#76 | 0.61%(+0.553)#9,085 |
| 77. | 84725 | 1.1% | 0.32%(+0.809)#77 | 0.61%(+0.527)#9,196 |
| 78. | 84643 | 1.1% | 0.32%(+0.776)#78 | 0.61%(+0.493)#9,319 |
| 79. | 84069 | 1.1% | 0.32%(+0.776)#79 | 0.61%(+0.493)#9,320 |
| 80. | 84052 | 0.98% | 0.32%(+0.660)#80 | 0.61%(+0.377)#9,827 |
| 81. | 84532 | 0.94% | 0.32%(+0.615)#81 | 0.61%(+0.332)#10,057 |
| 82. | 84318 | 0.91% | 0.32%(+0.583)#82 | 0.61%(+0.300)#10,200 |
| 83. | 84720 | 0.90% | 0.32%(+0.577)#83 | 0.61%(+0.294)#10,237 |
| 84. | 84711 | 0.87% | 0.32%(+0.544)#84 | 0.61%(+0.261)#10,419 |
| 85. | 84047 | 0.84% | 0.32%(+0.519)#85 | 0.61%(+0.236)#10,556 |
| 86. | 84309 | 0.77% | 0.32%(+0.450)#86 | 0.61%(+0.168)#10,948 |
| 87. | 84648 | 0.75% | 0.32%(+0.430)#87 | 0.61%(+0.147)#11,062 |
| 88. | 84066 | 0.75% | 0.32%(+0.428)#88 | 0.61%(+0.145)#11,076 |
| 89. | 84055 | 0.71% | 0.32%(+0.386)#89 | 0.61%(+0.103)#11,330 |
| 90. | 84337 | 0.71% | 0.32%(+0.383)#90 | 0.61%(+0.100)#11,344 |
| 91. | 84111 | 0.70% | 0.32%(+0.374)#91 | 0.61%(+0.091)#11,404 |
| 92. | 84001 | 0.67% | 0.32%(+0.351)#92 | 0.61%(+0.068)#11,563 |
| 93. | 84339 | 0.63% | 0.32%(+0.309)#93 | 0.61%(+0.026)#11,809 |
| 94. | 84630 | 0.58% | 0.32%(+0.259)#94 | 0.61%(-0.024)#12,198 |
| 95. | 84115 | 0.54% | 0.32%(+0.219)#95 | 0.61%(-0.064)#12,510 |
| 96. | 84321 | 0.54% | 0.32%(+0.216)#96 | 0.61%(-0.067)#12,532 |
| 97. | 84035 | 0.53% | 0.32%(+0.206)#97 | 0.61%(-0.076)#12,611 |
| 98. | 84078 | 0.53% | 0.32%(+0.206)#98 | 0.61%(-0.077)#12,613 |
| 99. | 84036 | 0.51% | 0.32%(+0.188)#99 | 0.61%(-0.095)#12,748 |
| 100. | 84660 | 0.50% | 0.32%(+0.180)#100 | 0.61%(-0.102)#12,815 |
Common Questions
What are the Top 10 Zip Codes with the Highest Percentage of Population Employed in Farming, Fishing & Forestry in Utah?
Top 10 Zip Codes with the Highest Percentage of Population Employed in Farming, Fishing & Forestry in Utah are:
What zip code has the Highest Percentage of Population Employed in Farming, Fishing & Forestry in Utah?
84533 has the Highest Percentage of Population Employed in Farming, Fishing & Forestry in Utah with 50.0%.
What is the Percentage of Population Employed in Farming, Fishing & Forestry in the State of Utah?
Percentage of Population Employed in Farming, Fishing & Forestry in Utah is 0.32%.
What is the Percentage of Population Employed in Farming, Fishing & Forestry in the United States?
Percentage of Population Employed in Farming, Fishing & Forestry in the United States is 0.61%.