Zip Codes with the Highest Percentage of Population Employed in Transportation & Warehousing in Greeneville, TN
RELATED REPORTS & OPTIONS
Transportation & Warehousing
Greeneville
Compare Zip Codes
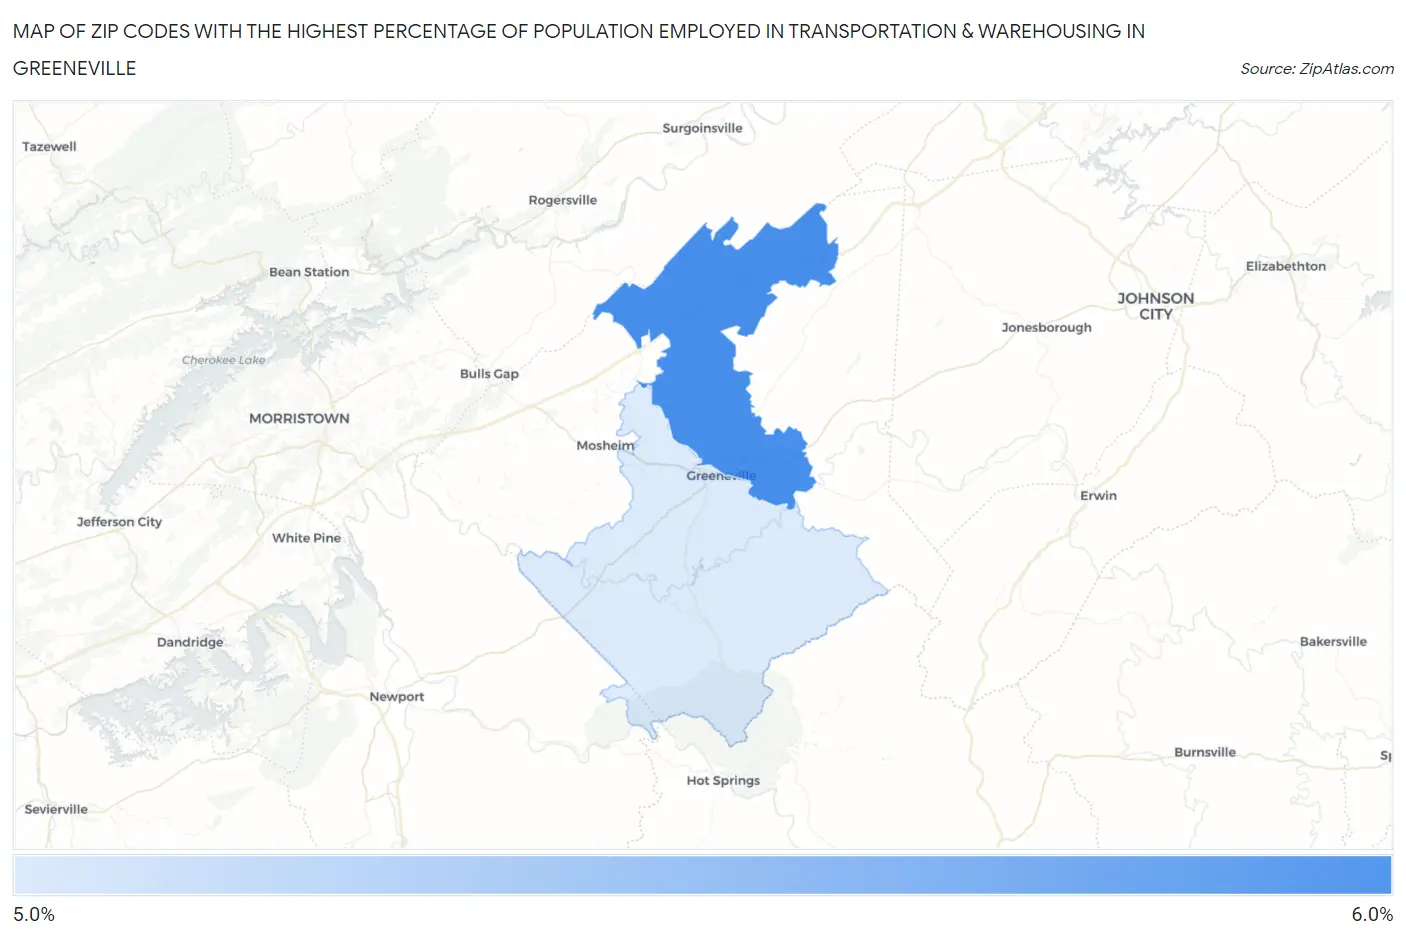
Map of Zip Codes with the Highest Percentage of Population Employed in Transportation & Warehousing in Greeneville
5.4%
5.8%
Zip Codes with the Highest Percentage of Population Employed in Transportation & Warehousing in Greeneville, TN
| Zip Code | % Employed | vs State | vs National | |
| 1. | 37745 | 5.8% | 6.1%(-0.356)#242 | 4.9%(+0.809)#9,487 |
| 2. | 37743 | 5.4% | 6.1%(-0.678)#271 | 4.9%(+0.487)#10,452 |
1
Common Questions
What are the Top Zip Codes with the Highest Percentage of Population Employed in Transportation & Warehousing in Greeneville, TN?
Top Zip Codes with the Highest Percentage of Population Employed in Transportation & Warehousing in Greeneville, TN are:
What zip code has the Highest Percentage of Population Employed in Transportation & Warehousing in Greeneville, TN?
37745 has the Highest Percentage of Population Employed in Transportation & Warehousing in Greeneville, TN with 5.8%.
What is the Percentage of Population Employed in Transportation & Warehousing in Greeneville, TN?
Percentage of Population Employed in Transportation & Warehousing in Greeneville is 5.0%.
What is the Percentage of Population Employed in Transportation & Warehousing in Tennessee?
Percentage of Population Employed in Transportation & Warehousing in Tennessee is 6.1%.
What is the Percentage of Population Employed in Transportation & Warehousing in the United States?
Percentage of Population Employed in Transportation & Warehousing in the United States is 4.9%.