Zip Codes with the Highest Percentage of Households Heated by Bottled Gas / Liquid Propane in Greeneville, TN
RELATED REPORTS & OPTIONS
Bottled Gas / LP Heating
Greeneville
Compare Zip Codes
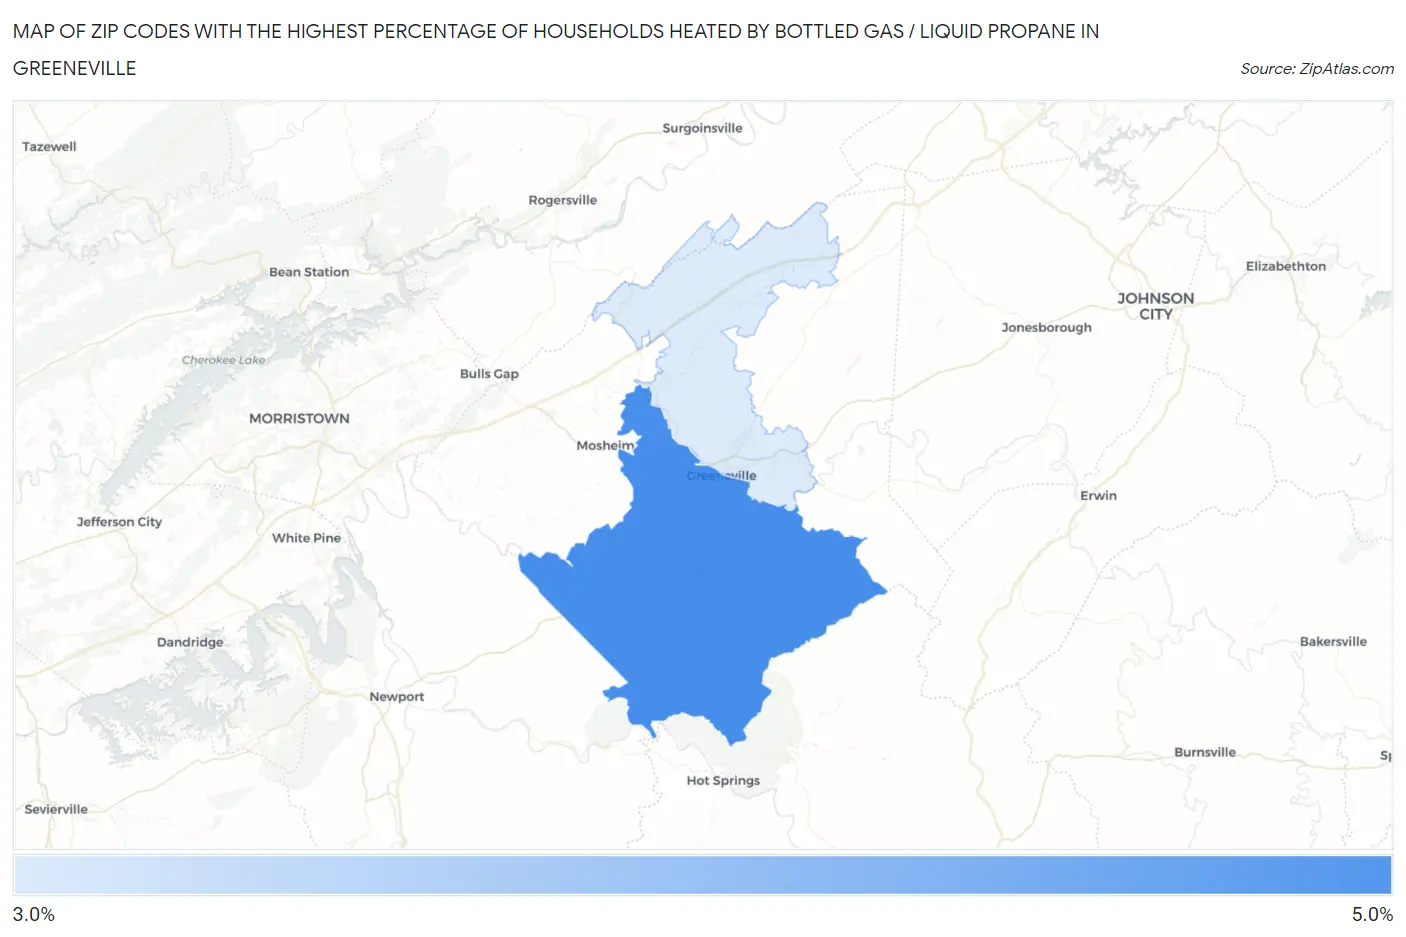
Map of Zip Codes with the Highest Percentage of Households Heated by Bottled Gas / Liquid Propane in Greeneville
3.1%
4.7%
Zip Codes with the Highest Percentage of Households Heated by Bottled Gas / Liquid Propane in Greeneville, TN
| Zip Code | Bottled Gas / LP Heating | vs State | vs National | |
| 1. | 37743 | 4.7% | 3.6%(+1.10)#319 | 4.9%(-0.200)#18,843 |
| 2. | 37745 | 3.1% | 3.6%(-0.500)#397 | 4.9%(-1.80)#20,877 |
1
Common Questions
What are the Top Zip Codes with the Highest Percentage of Households Heated by Bottled Gas / Liquid Propane in Greeneville, TN?
Top Zip Codes with the Highest Percentage of Households Heated by Bottled Gas / Liquid Propane in Greeneville, TN are:
What zip code has the Highest Percentage of Households Heated by Bottled Gas / Liquid Propane in Greeneville, TN?
37743 has the Highest Percentage of Households Heated by Bottled Gas / Liquid Propane in Greeneville, TN with 4.7%.
What is the Percentage of Households Heated by Bottled Gas / Liquid Propane in Greeneville, TN?
Percentage of Households Heated by Bottled Gas / Liquid Propane in Greeneville is 1.4%.
What is the Percentage of Households Heated by Bottled Gas / Liquid Propane in Tennessee?
Percentage of Households Heated by Bottled Gas / Liquid Propane in Tennessee is 3.6%.
What is the Percentage of Households Heated by Bottled Gas / Liquid Propane in the United States?
Percentage of Households Heated by Bottled Gas / Liquid Propane in the United States is 4.9%.