Zip Codes with the Highest Percentage of Population Employed in Professional & Scientific Services in Greeneville, TN
RELATED REPORTS & OPTIONS
Professional & Scientific Services
Greeneville
Compare Zip Codes
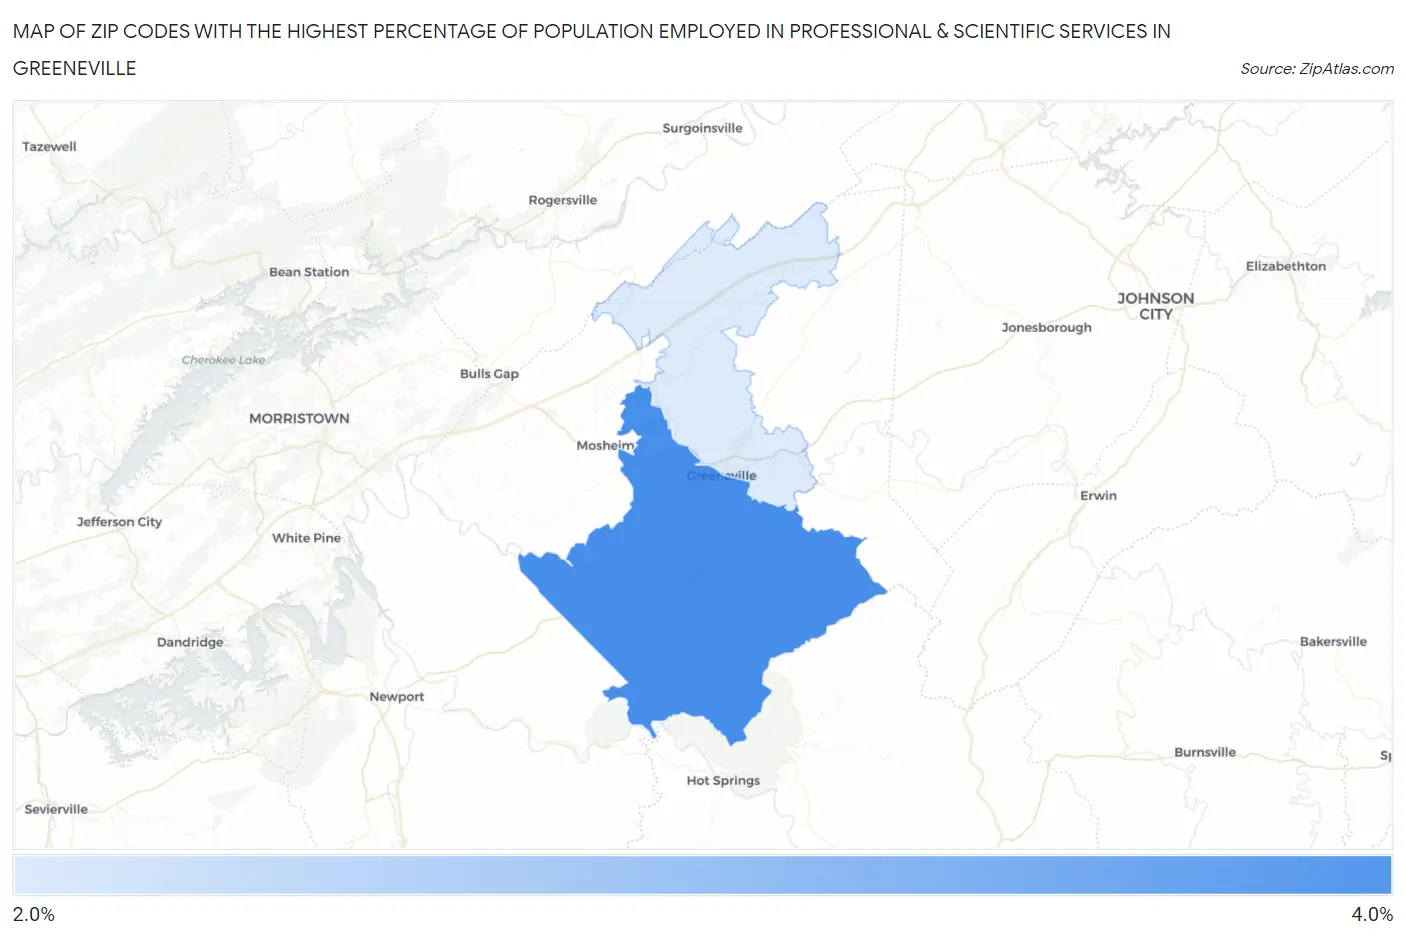
Map of Zip Codes with the Highest Percentage of Population Employed in Professional & Scientific Services in Greeneville
2.5%
3.5%
Zip Codes with the Highest Percentage of Population Employed in Professional & Scientific Services in Greeneville, TN
| Zip Code | % Employed | vs State | vs National | |
| 1. | 37743 | 3.5% | 5.7%(-2.20)#275 | 7.8%(-4.32)#16,636 |
| 2. | 37745 | 2.5% | 5.7%(-3.19)#350 | 7.8%(-5.32)#20,069 |
1
Common Questions
What are the Top Zip Codes with the Highest Percentage of Population Employed in Professional & Scientific Services in Greeneville, TN?
Top Zip Codes with the Highest Percentage of Population Employed in Professional & Scientific Services in Greeneville, TN are:
What zip code has the Highest Percentage of Population Employed in Professional & Scientific Services in Greeneville, TN?
37743 has the Highest Percentage of Population Employed in Professional & Scientific Services in Greeneville, TN with 3.5%.
What is the Percentage of Population Employed in Professional & Scientific Services in Greeneville, TN?
Percentage of Population Employed in Professional & Scientific Services in Greeneville is 2.4%.
What is the Percentage of Population Employed in Professional & Scientific Services in Tennessee?
Percentage of Population Employed in Professional & Scientific Services in Tennessee is 5.7%.
What is the Percentage of Population Employed in Professional & Scientific Services in the United States?
Percentage of Population Employed in Professional & Scientific Services in the United States is 7.8%.