Zip Codes with the Highest Percentage of Population Employed in Legal Services & Support in Greeneville, TN
RELATED REPORTS & OPTIONS
Legal Services & Support
Greeneville
Compare Zip Codes
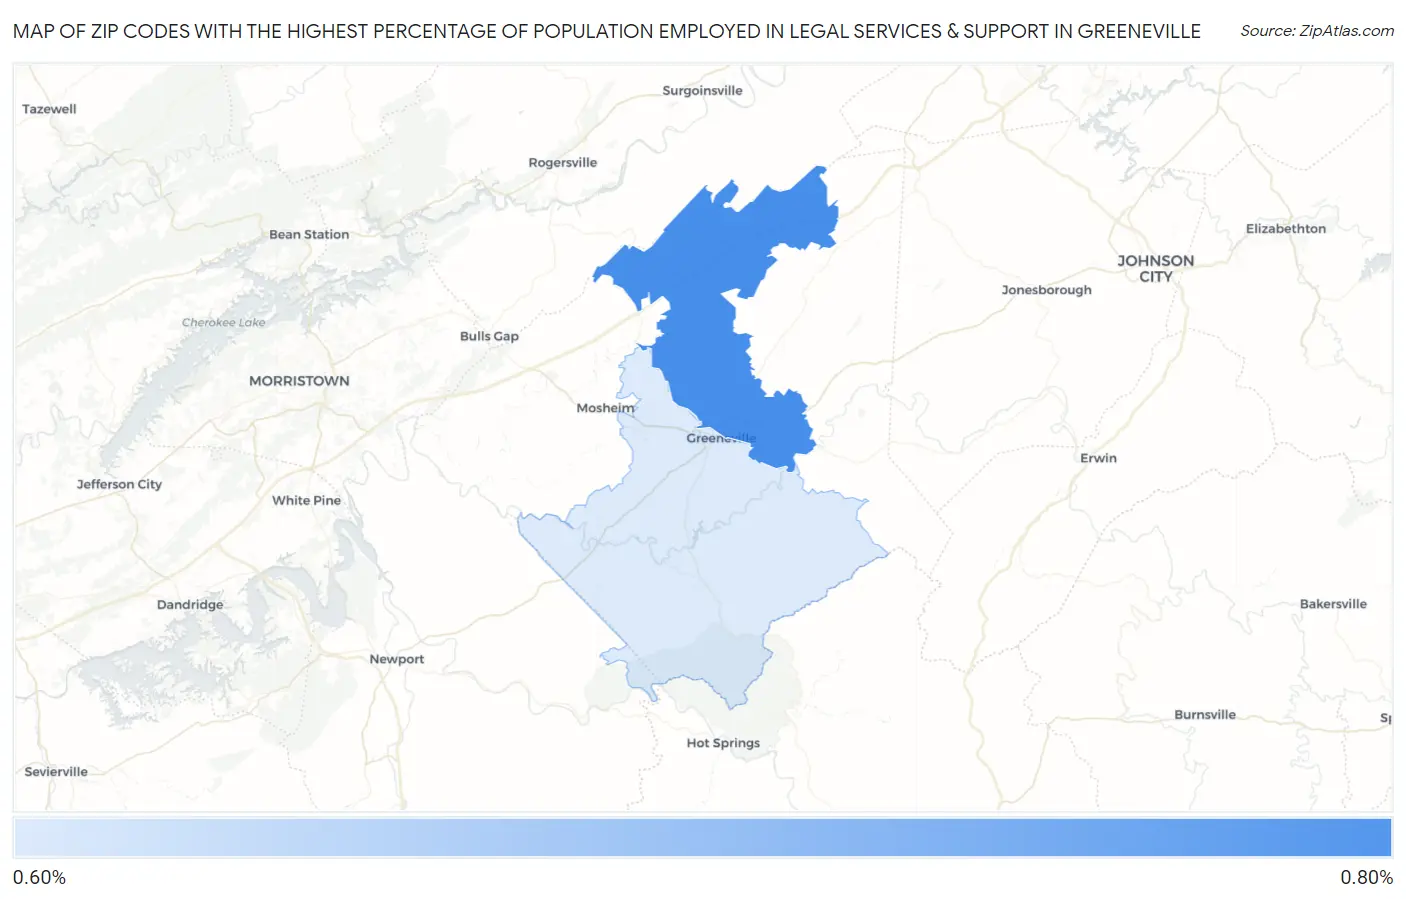
Map of Zip Codes with the Highest Percentage of Population Employed in Legal Services & Support in Greeneville
0.68%
0.69%
Zip Codes with the Highest Percentage of Population Employed in Legal Services & Support in Greeneville, TN
| Zip Code | % Employed | vs State | vs National | |
| 1. | 37745 | 0.69% | 0.90%(-0.207)#177 | 1.2%(-0.493)#10,499 |
| 2. | 37743 | 0.68% | 0.90%(-0.219)#179 | 1.2%(-0.505)#10,621 |
1
Common Questions
What are the Top Zip Codes with the Highest Percentage of Population Employed in Legal Services & Support in Greeneville, TN?
Top Zip Codes with the Highest Percentage of Population Employed in Legal Services & Support in Greeneville, TN are:
What zip code has the Highest Percentage of Population Employed in Legal Services & Support in Greeneville, TN?
37745 has the Highest Percentage of Population Employed in Legal Services & Support in Greeneville, TN with 0.69%.
What is the Percentage of Population Employed in Legal Services & Support in Greeneville, TN?
Percentage of Population Employed in Legal Services & Support in Greeneville is 0.29%.
What is the Percentage of Population Employed in Legal Services & Support in Tennessee?
Percentage of Population Employed in Legal Services & Support in Tennessee is 0.90%.
What is the Percentage of Population Employed in Legal Services & Support in the United States?
Percentage of Population Employed in Legal Services & Support in the United States is 1.2%.