Zip Codes with the Highest Percentage of Population with a Degree in Visual and Performing Arts in Greeneville, TN
RELATED REPORTS & OPTIONS
Visual and Performing Arts
Greeneville
Compare Zip Codes
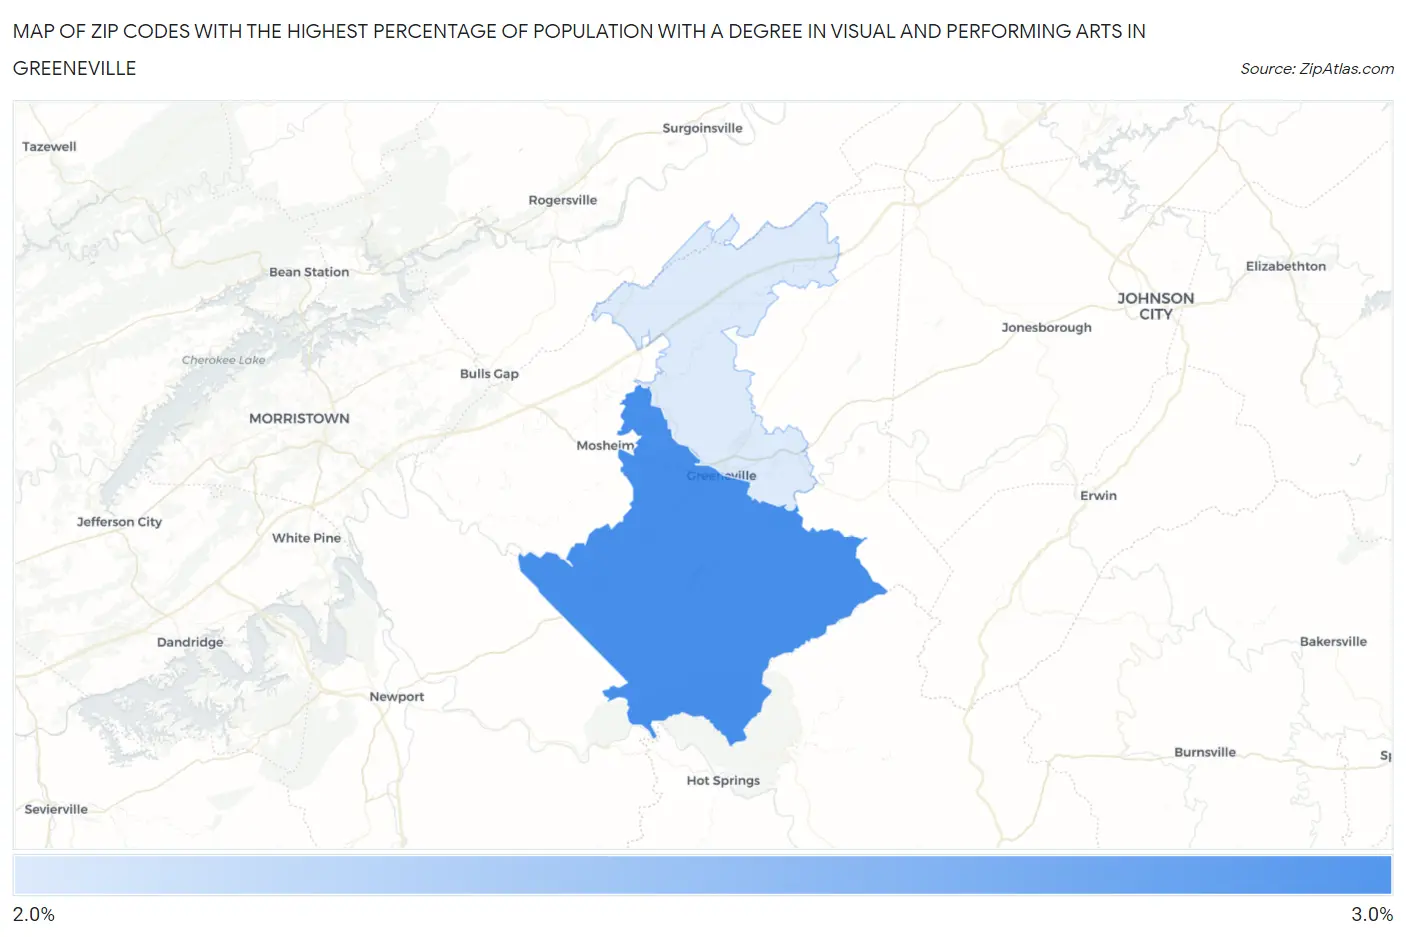
Map of Zip Codes with the Highest Percentage of Population with a Degree in Visual and Performing Arts in Greeneville
2.2%
2.6%
Zip Codes with the Highest Percentage of Population with a Degree in Visual and Performing Arts in Greeneville, TN
| Zip Code | % Graduates | vs State | vs National | |
| 1. | 37743 | 2.6% | 4.1%(-1.43)#253 | 4.3%(-1.62)#14,131 |
| 2. | 37745 | 2.2% | 4.1%(-1.87)#283 | 4.3%(-2.06)#15,741 |
1
Common Questions
What are the Top Zip Codes with the Highest Percentage of Population with a Degree in Visual and Performing Arts in Greeneville, TN?
Top Zip Codes with the Highest Percentage of Population with a Degree in Visual and Performing Arts in Greeneville, TN are:
What zip code has the Highest Percentage of Population with a Degree in Visual and Performing Arts in Greeneville, TN?
37743 has the Highest Percentage of Population with a Degree in Visual and Performing Arts in Greeneville, TN with 2.6%.
What is the Percentage of Population with a Degree in Visual and Performing Arts in Greeneville, TN?
Percentage of Population with a Degree in Visual and Performing Arts in Greeneville is 2.6%.
What is the Percentage of Population with a Degree in Visual and Performing Arts in Tennessee?
Percentage of Population with a Degree in Visual and Performing Arts in Tennessee is 4.1%.
What is the Percentage of Population with a Degree in Visual and Performing Arts in the United States?
Percentage of Population with a Degree in Visual and Performing Arts in the United States is 4.3%.