Zip Codes with the Highest Percentage of Self-Employed / Not Incorporated in Greeneville, TN
RELATED REPORTS & OPTIONS
Self-Employed / Not Incorporated
Greeneville
Compare Zip Codes
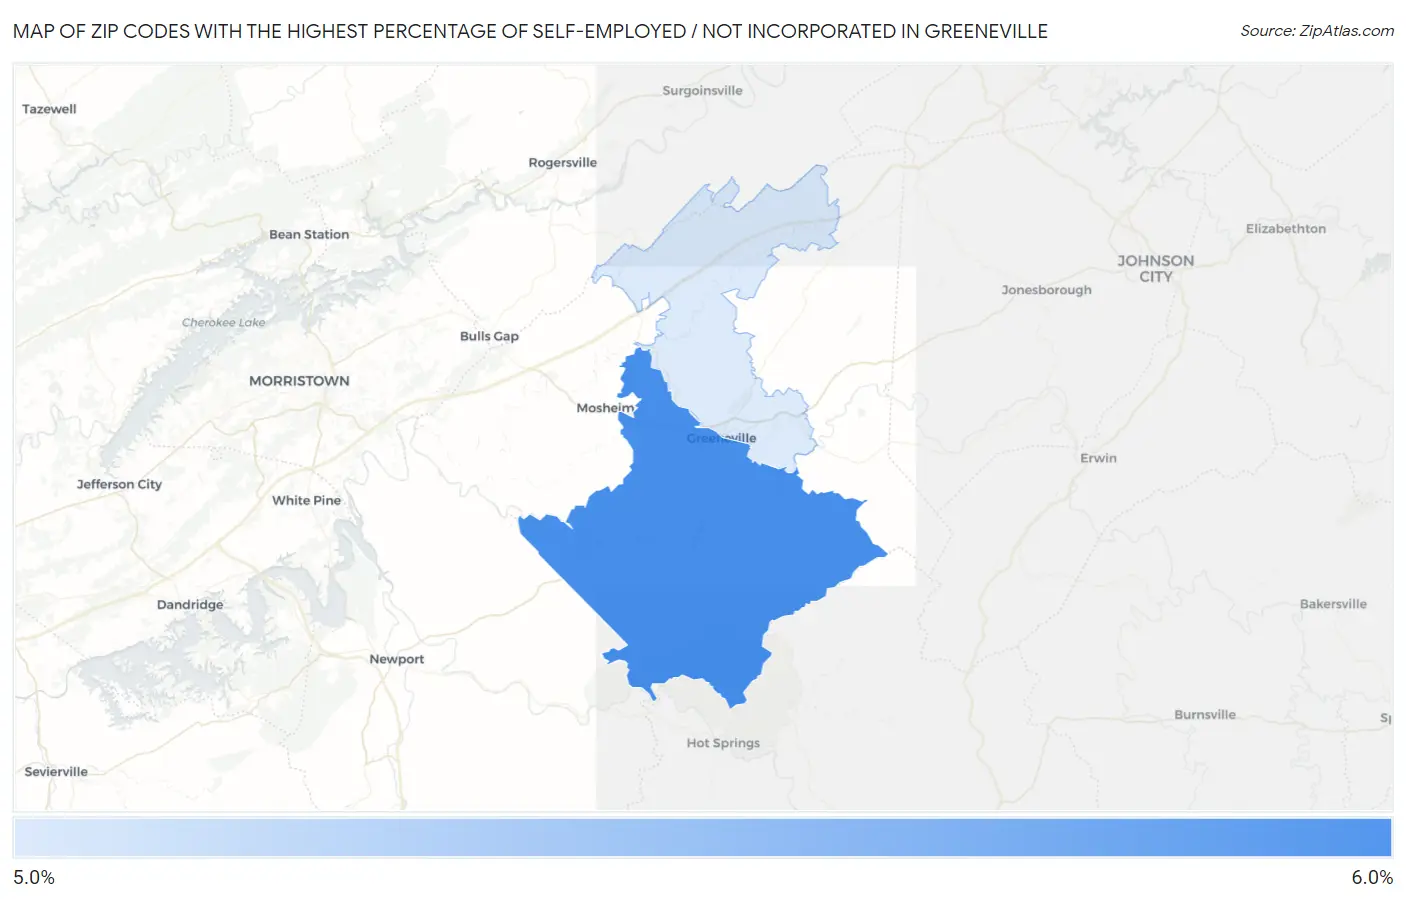
Map of Zip Codes with the Highest Percentage of Self-Employed / Not Incorporated in Greeneville
0.0%
6.0%
Zip Codes with the Highest Percentage of Self-Employed / Not Incorporated in Greeneville, TN
| Zip Code | % Self-Employed / Not Incorporated | vs State | vs National | |
| 1. | 37743 | 5.5% | 6.7%(-1.25)#422 | 5.8%(-0.355)#17,909 |
| 2. | 37745 | 5.1% | 6.7%(-1.61)#445 | 5.8%(-0.718)#19,300 |
1
Common Questions
What are the Top Zip Codes with the Highest Percentage of Self-Employed / Not Incorporated in Greeneville, TN?
Top Zip Codes with the Highest Percentage of Self-Employed / Not Incorporated in Greeneville, TN are:
What zip code has the Highest Percentage of Self-Employed / Not Incorporated in Greeneville, TN?
37743 has the Highest Percentage of Self-Employed / Not Incorporated in Greeneville, TN with 5.5%.
What is the Percentage of Self-Employed / Not Incorporated in Greeneville, TN?
Percentage of Self-Employed / Not Incorporated in Greeneville is 5.3%.
What is the Percentage of Self-Employed / Not Incorporated in Tennessee?
Percentage of Self-Employed / Not Incorporated in Tennessee is 6.7%.
What is the Percentage of Self-Employed / Not Incorporated in the United States?
Percentage of Self-Employed / Not Incorporated in the United States is 5.8%.