Zip Codes with the Highest Percentage of Households with Income Above $200,000 in Rhode Island
RELATED REPORTS & OPTIONS
Household Income | $200k+
Rhode Island
Compare Zip Codes
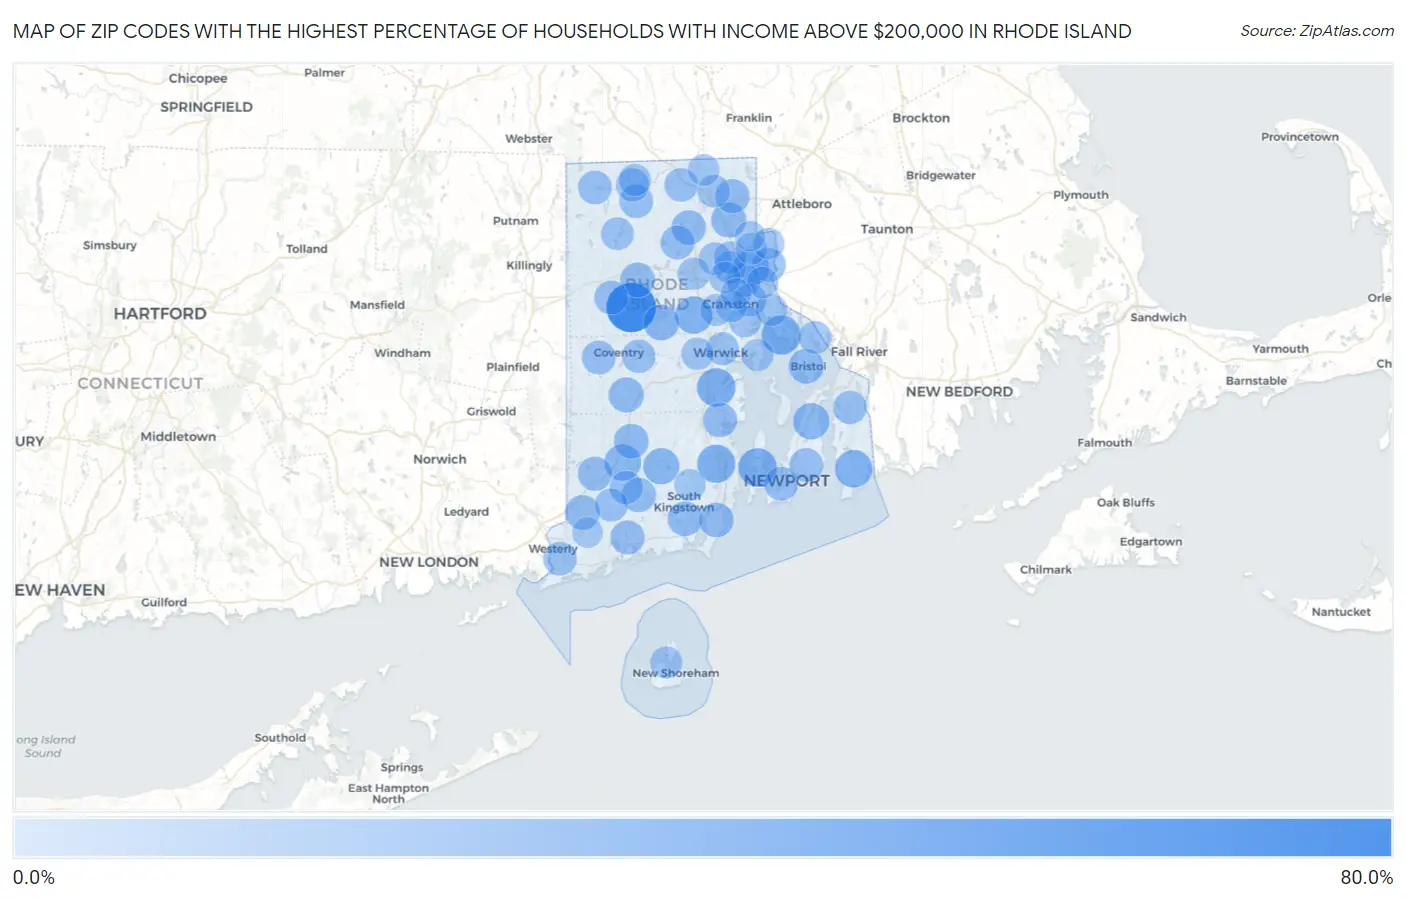
Map of Zip Codes with the Highest Percentage of Households with Income Above $200,000 in Rhode Island
0.0%
80.0%
Zip Codes with the Highest Percentage of Households with Income Above $200,000 in Rhode Island
| Zip Code | Households with Income > $200k | vs State | vs National | |
| 1. | 02815 | 74.0% | 11.3%(+62.7)#1 | 11.4%(+62.6)#45 |
| 2. | 02806 | 33.8% | 11.3%(+22.5)#2 | 11.4%(+22.4)#1,080 |
| 3. | 02835 | 31.3% | 11.3%(+20.0)#3 | 11.4%(+19.9)#1,321 |
| 4. | 02818 | 30.7% | 11.3%(+19.4)#4 | 11.4%(+19.3)#1,377 |
| 5. | 02874 | 29.4% | 11.3%(+18.1)#5 | 11.4%(+18.0)#1,538 |
| 6. | 02837 | 27.1% | 11.3%(+15.8)#6 | 11.4%(+15.7)#1,868 |
| 7. | 02921 | 27.0% | 11.3%(+15.7)#7 | 11.4%(+15.6)#1,886 |
| 8. | 02898 | 22.8% | 11.3%(+11.5)#8 | 11.4%(+11.4)#2,612 |
| 9. | 02871 | 22.7% | 11.3%(+11.4)#9 | 11.4%(+11.3)#2,625 |
| 10. | 02892 | 21.9% | 11.3%(+10.6)#10 | 11.4%(+10.5)#2,809 |
| 11. | 02906 | 21.3% | 11.3%(+10.00)#11 | 11.4%(+9.90)#2,934 |
| 12. | 02831 | 20.8% | 11.3%(+9.50)#12 | 11.4%(+9.40)#3,087 |
| 13. | 02865 | 18.6% | 11.3%(+7.30)#13 | 11.4%(+7.20)#3,678 |
| 14. | 02817 | 18.2% | 11.3%(+6.90)#14 | 11.4%(+6.80)#3,791 |
| 15. | 02809 | 17.7% | 11.3%(+6.40)#15 | 11.4%(+6.30)#3,939 |
| 16. | 02857 | 17.1% | 11.3%(+5.80)#16 | 11.4%(+5.70)#4,159 |
| 17. | 02804 | 16.8% | 11.3%(+5.50)#17 | 11.4%(+5.40)#4,271 |
| 18. | 02822 | 16.4% | 11.3%(+5.10)#18 | 11.4%(+5.00)#4,422 |
| 19. | 02879 | 16.3% | 11.3%(+5.00)#19 | 11.4%(+4.90)#4,451 |
| 20. | 02917 | 16.0% | 11.3%(+4.70)#20 | 11.4%(+4.60)#4,567 |
| 21. | 02882 | 15.9% | 11.3%(+4.60)#21 | 11.4%(+4.50)#4,615 |
| 22. | 02852 | 15.5% | 11.3%(+4.20)#22 | 11.4%(+4.10)#4,760 |
| 23. | 02875 | 15.1% | 11.3%(+3.80)#23 | 11.4%(+3.70)#4,969 |
| 24. | 02864 | 15.0% | 11.3%(+3.70)#24 | 11.4%(+3.60)#4,978 |
| 25. | 02832 | 14.7% | 11.3%(+3.40)#25 | 11.4%(+3.30)#5,143 |
| 26. | 02916 | 14.2% | 11.3%(+2.90)#26 | 11.4%(+2.80)#5,369 |
| 27. | 02813 | 14.2% | 11.3%(+2.90)#27 | 11.4%(+2.80)#5,371 |
| 28. | 02840 | 13.4% | 11.3%(+2.10)#28 | 11.4%(+2.00)#5,790 |
| 29. | 02828 | 13.4% | 11.3%(+2.10)#29 | 11.4%(+2.00)#5,811 |
| 30. | 02842 | 13.1% | 11.3%(+1.80)#30 | 11.4%(+1.70)#5,962 |
| 31. | 02825 | 13.1% | 11.3%(+1.80)#31 | 11.4%(+1.70)#5,972 |
| 32. | 02827 | 13.0% | 11.3%(+1.70)#32 | 11.4%(+1.60)#6,037 |
| 33. | 02859 | 12.8% | 11.3%(+1.50)#33 | 11.4%(+1.40)#6,150 |
| 34. | 02839 | 12.8% | 11.3%(+1.50)#34 | 11.4%(+1.40)#6,168 |
| 35. | 02903 | 12.5% | 11.3%(+1.20)#35 | 11.4%(+1.10)#6,348 |
| 36. | 02891 | 12.4% | 11.3%(+1.10)#36 | 11.4%(+1.000)#6,406 |
| 37. | 02896 | 12.4% | 11.3%(+1.10)#37 | 11.4%(+1.000)#6,420 |
| 38. | 02816 | 11.7% | 11.3%(+0.400)#38 | 11.4%(+0.300)#6,853 |
| 39. | 02878 | 11.6% | 11.3%(+0.300)#39 | 11.4%(+0.200)#6,943 |
| 40. | 02830 | 11.1% | 11.3%(-0.200)#40 | 11.4%(-0.300)#7,334 |
| 41. | 02812 | 10.9% | 11.3%(-0.400)#41 | 11.4%(-0.500)#7,509 |
| 42. | 02894 | 10.5% | 11.3%(-0.800)#42 | 11.4%(-0.900)#7,839 |
| 43. | 02886 | 10.0% | 11.3%(-1.30)#43 | 11.4%(-1.40)#8,249 |
| 44. | 02885 | 9.7% | 11.3%(-1.60)#44 | 11.4%(-1.70)#8,573 |
| 45. | 02905 | 9.3% | 11.3%(-2.00)#45 | 11.4%(-2.10)#8,936 |
| 46. | 02814 | 9.1% | 11.3%(-2.20)#46 | 11.4%(-2.30)#9,159 |
| 47. | 02911 | 8.5% | 11.3%(-2.80)#47 | 11.4%(-2.90)#9,770 |
| 48. | 02838 | 8.3% | 11.3%(-3.00)#48 | 11.4%(-3.10)#10,045 |
| 49. | 02919 | 8.0% | 11.3%(-3.30)#49 | 11.4%(-3.40)#10,364 |
| 50. | 02908 | 7.9% | 11.3%(-3.40)#50 | 11.4%(-3.50)#10,482 |
| 51. | 02893 | 7.9% | 11.3%(-3.40)#51 | 11.4%(-3.50)#10,494 |
| 52. | 02904 | 7.5% | 11.3%(-3.80)#52 | 11.4%(-3.90)#11,044 |
| 53. | 02920 | 7.2% | 11.3%(-4.10)#53 | 11.4%(-4.20)#11,486 |
| 54. | 02888 | 7.1% | 11.3%(-4.20)#54 | 11.4%(-4.30)#11,647 |
| 55. | 02826 | 7.0% | 11.3%(-4.30)#55 | 11.4%(-4.40)#11,886 |
| 56. | 02915 | 6.8% | 11.3%(-4.50)#56 | 11.4%(-4.60)#12,093 |
| 57. | 02889 | 6.7% | 11.3%(-4.60)#57 | 11.4%(-4.70)#12,224 |
| 58. | 02807 | 6.7% | 11.3%(-4.60)#58 | 11.4%(-4.70)#12,339 |
| 59. | 02910 | 6.4% | 11.3%(-4.90)#59 | 11.4%(-5.00)#12,737 |
| 60. | 02895 | 5.0% | 11.3%(-6.30)#60 | 11.4%(-6.40)#15,562 |
| 61. | 02860 | 4.7% | 11.3%(-6.60)#61 | 11.4%(-6.70)#16,256 |
| 62. | 02881 | 4.6% | 11.3%(-6.70)#62 | 11.4%(-6.80)#16,593 |
| 63. | 02914 | 4.5% | 11.3%(-6.80)#63 | 11.4%(-6.90)#16,786 |
| 64. | 02909 | 4.3% | 11.3%(-7.00)#64 | 11.4%(-7.10)#17,249 |
| 65. | 02861 | 3.9% | 11.3%(-7.40)#65 | 11.4%(-7.50)#18,346 |
| 66. | 02907 | 2.1% | 11.3%(-9.20)#66 | 11.4%(-9.30)#23,455 |
| 67. | 02808 | 1.1% | 11.3%(-10.2)#67 | 11.4%(-10.3)#26,038 |
| 68. | 02863 | 0.40% | 11.3%(-10.9)#68 | 11.4%(-11.0)#27,240 |
1
Common Questions
What are the Top 10 Zip Codes with the Highest Percentage of Households with Income Above $200,000 in Rhode Island?
Top 10 Zip Codes with the Highest Percentage of Households with Income Above $200,000 in Rhode Island are:
What zip code has the Highest Percentage of Households with Income Above $200,000 in Rhode Island?
02815 has the Highest Percentage of Households with Income Above $200,000 in Rhode Island with 74.0%.
What is the Percentage of Households with Income Above $200,000 in the State of Rhode Island?
Percentage of Households with Income Above $200,000 in Rhode Island is 11.3%.
What is the Percentage of Households with Income Above $200,000 in the United States?
Percentage of Households with Income Above $200,000 in the United States is 11.4%.