Zip Codes with the Highest Percentage of Population with a Degree in Literature and Languages in Rhode Island
RELATED REPORTS & OPTIONS
Literature and Languages
Rhode Island
Compare Zip Codes
Map of Zip Codes with the Highest Percentage of Population with a Degree in Literature and Languages in Rhode Island
0.0%
15.0%
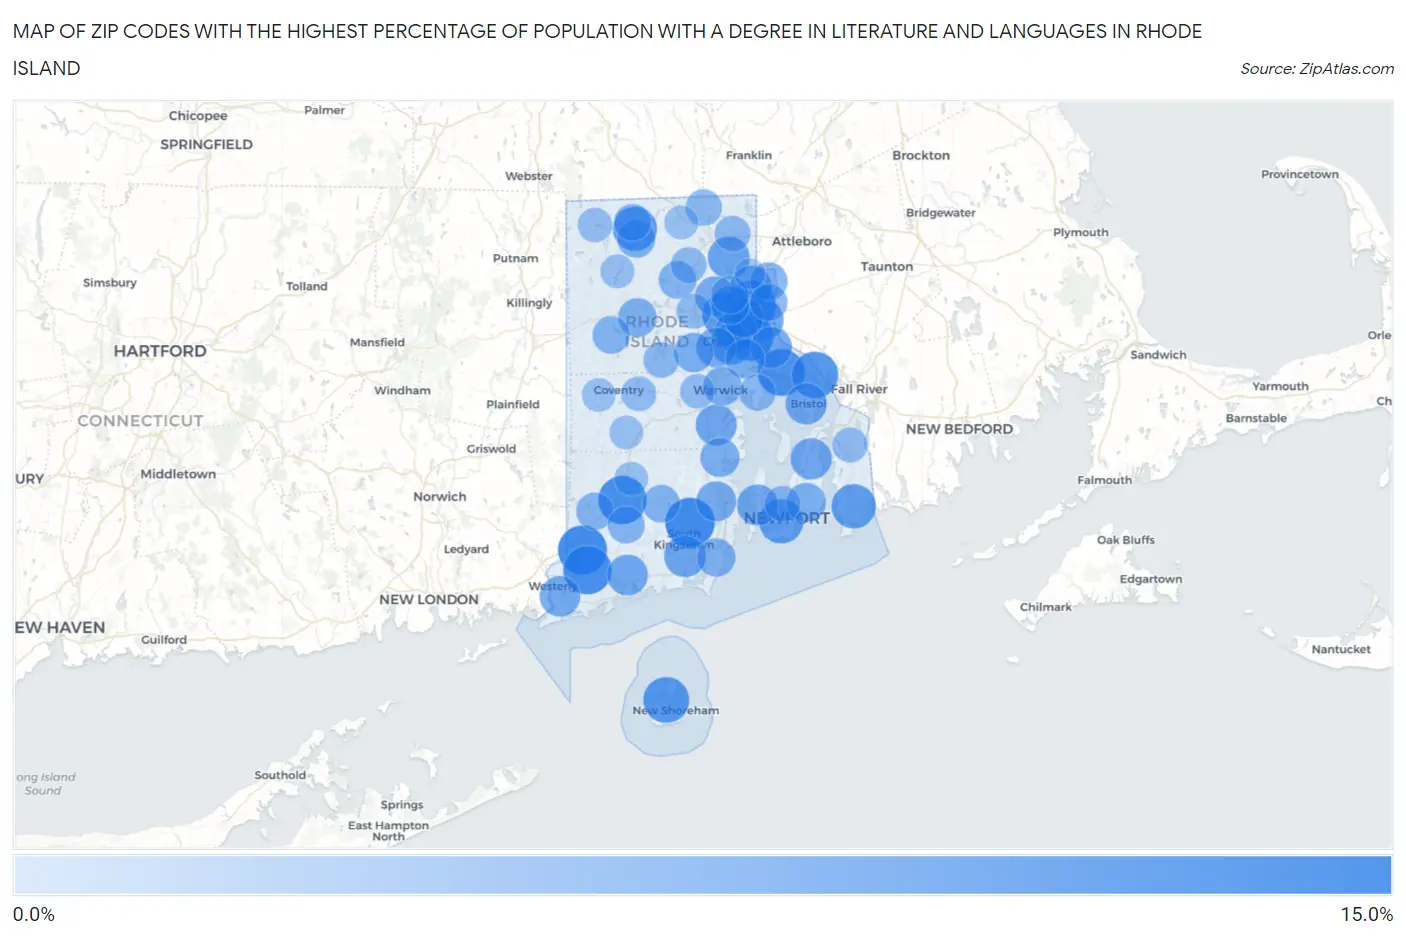
Zip Codes with the Highest Percentage of Population with a Degree in Literature and Languages in Rhode Island
| Zip Code | % Graduates | vs State | vs National | |
| 1. | 02881 | 13.0% | 6.6%(+6.39)#1 | 4.4%(+8.56)#1,054 |
| 2. | 02804 | 12.7% | 6.6%(+6.10)#2 | 4.4%(+8.28)#1,102 |
| 3. | 02808 | 12.3% | 6.6%(+5.73)#3 | 4.4%(+7.91)#1,165 |
| 4. | 02906 | 12.3% | 6.6%(+5.68)#4 | 4.4%(+7.85)#1,178 |
| 5. | 02898 | 12.1% | 6.6%(+5.55)#5 | 4.4%(+7.73)#1,195 |
| 6. | 02806 | 11.4% | 6.6%(+4.78)#6 | 4.4%(+6.95)#1,371 |
| 7. | 02885 | 11.0% | 6.6%(+4.41)#7 | 4.4%(+6.59)#1,473 |
| 8. | 02905 | 10.9% | 6.6%(+4.36)#8 | 4.4%(+6.53)#1,496 |
| 9. | 02807 | 10.5% | 6.6%(+3.93)#9 | 4.4%(+6.10)#1,636 |
| 10. | 02909 | 10.2% | 6.6%(+3.64)#10 | 4.4%(+5.81)#1,735 |
| 11. | 02837 | 9.5% | 6.6%(+2.94)#11 | 4.4%(+5.11)#2,037 |
| 12. | 02840 | 9.5% | 6.6%(+2.91)#12 | 4.4%(+5.08)#2,046 |
| 13. | 02858 | 9.3% | 6.6%(+2.69)#13 | 4.4%(+4.87)#2,163 |
| 14. | 02914 | 7.9% | 6.6%(+1.34)#14 | 4.4%(+3.52)#3,047 |
| 15. | 02865 | 7.8% | 6.6%(+1.25)#15 | 4.4%(+3.43)#3,123 |
| 16. | 02907 | 7.8% | 6.6%(+1.23)#16 | 4.4%(+3.41)#3,144 |
| 17. | 02910 | 7.7% | 6.6%(+1.11)#17 | 4.4%(+3.28)#3,275 |
| 18. | 02879 | 7.6% | 6.6%(+1.06)#18 | 4.4%(+3.23)#3,313 |
| 19. | 02915 | 7.5% | 6.6%(+0.885)#19 | 4.4%(+3.06)#3,477 |
| 20. | 02809 | 7.4% | 6.6%(+0.809)#20 | 4.4%(+2.98)#3,561 |
| 21. | 02860 | 7.4% | 6.6%(+0.806)#21 | 4.4%(+2.98)#3,562 |
| 22. | 02871 | 7.4% | 6.6%(+0.766)#22 | 4.4%(+2.94)#3,605 |
| 23. | 02818 | 7.2% | 6.6%(+0.665)#23 | 4.4%(+2.84)#3,708 |
| 24. | 02835 | 7.2% | 6.6%(+0.635)#24 | 4.4%(+2.81)#3,737 |
| 25. | 02813 | 7.1% | 6.6%(+0.497)#25 | 4.4%(+2.67)#3,897 |
| 26. | 02891 | 6.9% | 6.6%(+0.278)#26 | 4.4%(+2.45)#4,163 |
| 27. | 02874 | 6.5% | 6.6%(-0.037)#27 | 4.4%(+2.14)#4,583 |
| 28. | 02920 | 6.4% | 6.6%(-0.159)#28 | 4.4%(+2.02)#4,755 |
| 29. | 02911 | 6.4% | 6.6%(-0.163)#29 | 4.4%(+2.01)#4,764 |
| 30. | 02903 | 6.3% | 6.6%(-0.250)#30 | 4.4%(+1.92)#4,884 |
| 31. | 02842 | 6.2% | 6.6%(-0.417)#31 | 4.4%(+1.76)#5,143 |
| 32. | 02921 | 6.1% | 6.6%(-0.440)#32 | 4.4%(+1.73)#5,186 |
| 33. | 02888 | 6.0% | 6.6%(-0.613)#33 | 4.4%(+1.56)#5,454 |
| 34. | 02852 | 5.8% | 6.6%(-0.757)#34 | 4.4%(+1.42)#5,707 |
| 35. | 02908 | 5.8% | 6.6%(-0.825)#35 | 4.4%(+1.35)#5,826 |
| 36. | 02886 | 5.6% | 6.6%(-1.03)#36 | 4.4%(+1.15)#6,209 |
| 37. | 02857 | 5.5% | 6.6%(-1.09)#37 | 4.4%(+1.09)#6,325 |
| 38. | 02882 | 5.4% | 6.6%(-1.14)#38 | 4.4%(+1.03)#6,424 |
| 39. | 02839 | 5.2% | 6.6%(-1.36)#39 | 4.4%(+0.814)#6,893 |
| 40. | 02861 | 5.0% | 6.6%(-1.63)#40 | 4.4%(+0.546)#7,471 |
| 41. | 02828 | 4.9% | 6.6%(-1.67)#41 | 4.4%(+0.503)#7,586 |
| 42. | 02904 | 4.9% | 6.6%(-1.71)#42 | 4.4%(+0.460)#7,703 |
| 43. | 02892 | 4.9% | 6.6%(-1.73)#43 | 4.4%(+0.446)#7,743 |
| 44. | 02825 | 4.8% | 6.6%(-1.78)#44 | 4.4%(+0.399)#7,865 |
| 45. | 02832 | 4.8% | 6.6%(-1.82)#45 | 4.4%(+0.352)#8,000 |
| 46. | 02916 | 4.7% | 6.6%(-1.87)#46 | 4.4%(+0.306)#8,129 |
| 47. | 02830 | 4.5% | 6.6%(-2.06)#47 | 4.4%(+0.119)#8,645 |
| 48. | 02812 | 4.5% | 6.6%(-2.10)#48 | 4.4%(+0.079)#8,743 |
| 49. | 02895 | 4.2% | 6.6%(-2.43)#49 | 4.4%(-0.253)#9,752 |
| 50. | 02889 | 4.1% | 6.6%(-2.52)#50 | 4.4%(-0.347)#10,014 |
| 51. | 02864 | 3.7% | 6.6%(-2.84)#51 | 4.4%(-0.666)#11,005 |
| 52. | 02831 | 3.7% | 6.6%(-2.91)#52 | 4.4%(-0.733)#11,244 |
| 53. | 02841 | 3.6% | 6.6%(-2.97)#53 | 4.4%(-0.799)#11,450 |
| 54. | 02917 | 3.6% | 6.6%(-2.98)#54 | 4.4%(-0.802)#11,466 |
| 55. | 02919 | 3.2% | 6.6%(-3.39)#55 | 4.4%(-1.22)#12,949 |
| 56. | 02878 | 3.2% | 6.6%(-3.40)#56 | 4.4%(-1.22)#12,955 |
| 57. | 02893 | 3.1% | 6.6%(-3.52)#57 | 4.4%(-1.35)#13,358 |
| 58. | 02816 | 3.0% | 6.6%(-3.54)#58 | 4.4%(-1.36)#13,419 |
| 59. | 02859 | 2.9% | 6.6%(-3.72)#59 | 4.4%(-1.55)#14,023 |
| 60. | 02814 | 2.4% | 6.6%(-4.16)#60 | 4.4%(-1.99)#15,597 |
| 61. | 02896 | 2.4% | 6.6%(-4.21)#61 | 4.4%(-2.03)#15,745 |
| 62. | 02817 | 2.3% | 6.6%(-4.25)#62 | 4.4%(-2.08)#15,920 |
| 63. | 02822 | 2.3% | 6.6%(-4.25)#63 | 4.4%(-2.08)#15,928 |
| 64. | 02827 | 2.3% | 6.6%(-4.26)#64 | 4.4%(-2.09)#15,972 |
| 65. | 02863 | 0.22% | 6.6%(-6.36)#65 | 4.4%(-4.19)#21,620 |
1
Common Questions
What are the Top 10 Zip Codes with the Highest Percentage of Population with a Degree in Literature and Languages in Rhode Island?
Top 10 Zip Codes with the Highest Percentage of Population with a Degree in Literature and Languages in Rhode Island are:
What zip code has the Highest Percentage of Population with a Degree in Literature and Languages in Rhode Island?
02881 has the Highest Percentage of Population with a Degree in Literature and Languages in Rhode Island with 13.0%.
What is the Percentage of Population with a Degree in Literature and Languages in the State of Rhode Island?
Percentage of Population with a Degree in Literature and Languages in Rhode Island is 6.6%.
What is the Percentage of Population with a Degree in Literature and Languages in the United States?
Percentage of Population with a Degree in Literature and Languages in the United States is 4.4%.