Zip Codes with the Highest Percentage of Population Employed in Firefighting & Prevention in Rhode Island

RELATED REPORTS & OPTIONS

Firefighting & Prevention
Population
Families and Households
Female Fertility
Female Fertility (Unmarried)
Race (Community Size)
Race (Percentage)
Ancestry (Community Size)
AfghanAfricanAlaska NativeAlaskan AthabascanAlbanianAleutAlsatianAmericanApacheArabArapahoArgentineanArmenianAssyrian / Chaldean / SyriacAustralianAustrianBahamianBangladeshiBarbadianBasqueBelgianBelizeanBermudanBhutaneseBlackfeetBolivianBrazilianBritishBritish West IndianBulgarianBurmeseCajunCambodianCanadianCape VerdeanCarpatho RusynCelticCentral AmericanCentral American IndianCherokeeCheyenneChickasawChileanChineseChippewaChoctawColombianColvilleComancheCosta RicanCreeCreekCroatianCrowCubanCypriotCzechCzechoslovakianDanishDelawareDominicanDutchDutch West IndianEastern EuropeanEcuadorianEgyptianEnglishEstonianEthiopianEuropeanFijianFilipinoFinnishFrenchFrench American IndianFrench CanadianGermanGerman RussianGhanaianGreekGuamanian / ChamorroGuatemalanGuyaneseHaitianHmongHonduranHopiHoumaHungarianIcelanderIndian (Asian)IndonesianInupiatIranianIraqiIrishIroquoisIsraeliItalianJamaicanJapaneseJordanianKenyanKiowaKoreanLaotianLatvianLebaneseLiberianLithuanianLumbeeLuxembourgerMacedonianMalaysianMalteseMarshalleseMenomineeMexicanMexican American IndianMongolianMoroccanNative HawaiianNavajoNepaleseNew ZealanderNicaraguanNigerianNorthern EuropeanNorwegianOkinawanOsageOttawaPaiutePakistaniPalestinianPanamanianParaguayanPennsylvania GermanPeruvianPimaPolishPortuguesePotawatomiPuebloPuerto RicanPuget Sound SalishRomanianRussianSalvadoranSamoanScandinavianScotch-IrishScottishSeminoleSenegaleseSerbianShoshoneSierra LeoneanSiouxSlavicSlovakSloveneSomaliSouth AfricanSouth AmericanSouth American IndianSoviet UnionSpaniardSpanishSpanish AmericanSpanish American IndianSri LankanSubsaharan AfricanSudaneseSwedishSwissSyrianTaiwaneseThaiTlingit-HaidaTohono O'OdhamTonganTrinidadian and TobagonianTsimshianTurkishU.S. Virgin IslanderUgandanUkrainianUruguayanUteVenezuelanVietnameseWelshWest IndianYakamaYaquiYugoslavianYumanYup'ikZimbabwean
Ancestry (Percentage)
AfghanAfricanAlaska NativeAlaskan AthabascanAlbanianAleutAlsatianAmericanApacheArabArapahoArgentineanArmenianAssyrian / Chaldean / SyriacAustralianAustrianBahamianBangladeshiBarbadianBasqueBelgianBelizeanBermudanBhutaneseBlackfeetBolivianBrazilianBritishBritish West IndianBulgarianBurmeseCajunCambodianCanadianCape VerdeanCarpatho RusynCelticCentral AmericanCentral American IndianCherokeeCheyenneChickasawChileanChineseChippewaChoctawColombianColvilleComancheCosta RicanCreeCreekCroatianCrowCubanCypriotCzechCzechoslovakianDanishDelawareDominicanDutchDutch West IndianEastern EuropeanEcuadorianEgyptianEnglishEstonianEthiopianEuropeanFijianFilipinoFinnishFrenchFrench American IndianFrench CanadianGermanGerman RussianGhanaianGreekGuamanian / ChamorroGuatemalanGuyaneseHaitianHmongHonduranHopiHoumaHungarianIcelanderIndian (Asian)IndonesianInupiatIranianIraqiIrishIroquoisIsraeliItalianJamaicanJapaneseJordanianKenyanKiowaKoreanLaotianLatvianLebaneseLiberianLithuanianLumbeeLuxembourgerMacedonianMalaysianMalteseMarshalleseMenomineeMexicanMexican American IndianMongolianMoroccanNative HawaiianNavajoNepaleseNew ZealanderNicaraguanNigerianNorthern EuropeanNorwegianOkinawanOsageOttawaPaiutePakistaniPalestinianPanamanianParaguayanPennsylvania GermanPeruvianPimaPolishPortuguesePotawatomiPuebloPuerto RicanPuget Sound SalishRomanianRussianSalvadoranSamoanScandinavianScotch-IrishScottishSeminoleSenegaleseSerbianShoshoneSierra LeoneanSiouxSlavicSlovakSloveneSomaliSouth AfricanSouth AmericanSouth American IndianSoviet UnionSpaniardSpanishSpanish AmericanSpanish American IndianSri LankanSubsaharan AfricanSudaneseSwedishSwissSyrianTaiwaneseThaiTlingit-HaidaTohono O'OdhamTonganTrinidadian and TobagonianTsimshianTurkishU.S. Virgin IslanderUgandanUkrainianUruguayanUteVenezuelanVietnameseWelshWest IndianYakamaYaquiYugoslavianYumanYup'ikZimbabwean
Immigrant Origin (Total)
AfghanistanAfricaAlbaniaArgentinaArmeniaAsiaAustraliaAustriaAzoresBahamasBangladeshBarbadosBelarusBelgiumBelizeBoliviaBosnia and HerzegovinaBrazilBulgariaBurma / MyanmarCabo VerdeCambodiaCameroonCanadaCaribbeanCentral AmericaChileChinaColombiaCongoCosta RicaCroatiaCubaCzechoslovakiaDenmarkDominicaDominican RepublicEastern AfricaEastern AsiaEastern EuropeEcuadorEgyptEl SalvadorEnglandEritreaEthiopiaEuropeFijiFranceGermanyGhanaGreeceGrenadaGuatemalaGuyanaHaitiHondurasHong KongHungaryIndiaIndonesiaIranIraqIrelandIsraelItalyJamaicaJapanJordanKazakhstanKenyaKoreaKuwaitLaosLatin AmericaLatviaLebanonLiberiaLithuaniaMalaysiaMexicoMicronesiaMiddle AfricaMoldovaMoroccoNepalNetherlandsNicaraguaNigeriaNorth MacedoniaNorthern AfricaNorthern EuropeNorwayOceaniaPakistanPanamaPeruPhilippinesPolandPortugalRomaniaRussiaSaudi ArabiaScotlandSenegalSerbiaSierra LeoneSingaporeSomaliaSouth AfricaSouth AmericaSouth Central AsiaSouth Eastern AsiaSouthern EuropeSpainSri LankaSt. Vincent and the GrenadinesSudanSwedenSwitzerlandSyriaTaiwanThailandTrinidad and TobagoTurkeyUgandaUkraineUruguayUzbekistanVenezuelaVietnamWest IndiesWestern AfricaWestern AsiaWestern EuropeYemenZaireZimbabwe
Immigrant Origin (Percentage)
AfghanistanAfricaAlbaniaArgentinaArmeniaAsiaAustraliaAustriaAzoresBahamasBangladeshBarbadosBelarusBelgiumBelizeBoliviaBosnia and HerzegovinaBrazilBulgariaBurma / MyanmarCabo VerdeCambodiaCameroonCanadaCaribbeanCentral AmericaChileChinaColombiaCongoCosta RicaCroatiaCubaCzechoslovakiaDenmarkDominicaDominican RepublicEastern AfricaEastern AsiaEastern EuropeEcuadorEgyptEl SalvadorEnglandEritreaEthiopiaEuropeFijiFranceGermanyGhanaGreeceGrenadaGuatemalaGuyanaHaitiHondurasHong KongHungaryIndiaIndonesiaIranIraqIrelandIsraelItalyJamaicaJapanJordanKazakhstanKenyaKoreaKuwaitLaosLatin AmericaLatviaLebanonLiberiaLithuaniaMalaysiaMexicoMicronesiaMiddle AfricaMoldovaMoroccoNepalNetherlandsNicaraguaNigeriaNorth MacedoniaNorthern AfricaNorthern EuropeNorwayOceaniaPakistanPanamaPeruPhilippinesPolandPortugalRomaniaRussiaSaudi ArabiaScotlandSenegalSerbiaSierra LeoneSingaporeSomaliaSouth AfricaSouth AmericaSouth Central AsiaSouth Eastern AsiaSouthern EuropeSpainSri LankaSt. Vincent and the GrenadinesSudanSwedenSwitzerlandSyriaTaiwanThailandTrinidad and TobagoTurkeyUgandaUkraineUruguayUzbekistanVenezuelaVietnamWest IndiesWestern AfricaWestern AsiaWestern EuropeYemenZaireZimbabwe
Income
Income (Families)
Income (Households)
Poverty
Poverty (Families)
Unemployment
Employment Occupations
Employment Industries
Employer Class
Commute Time
Commute Means
School Enrollment
Education by Degree Field
Occupancy
Finances
Physical Characteristics
Rhode Island
Compare Zip Codes
Comparison Subject

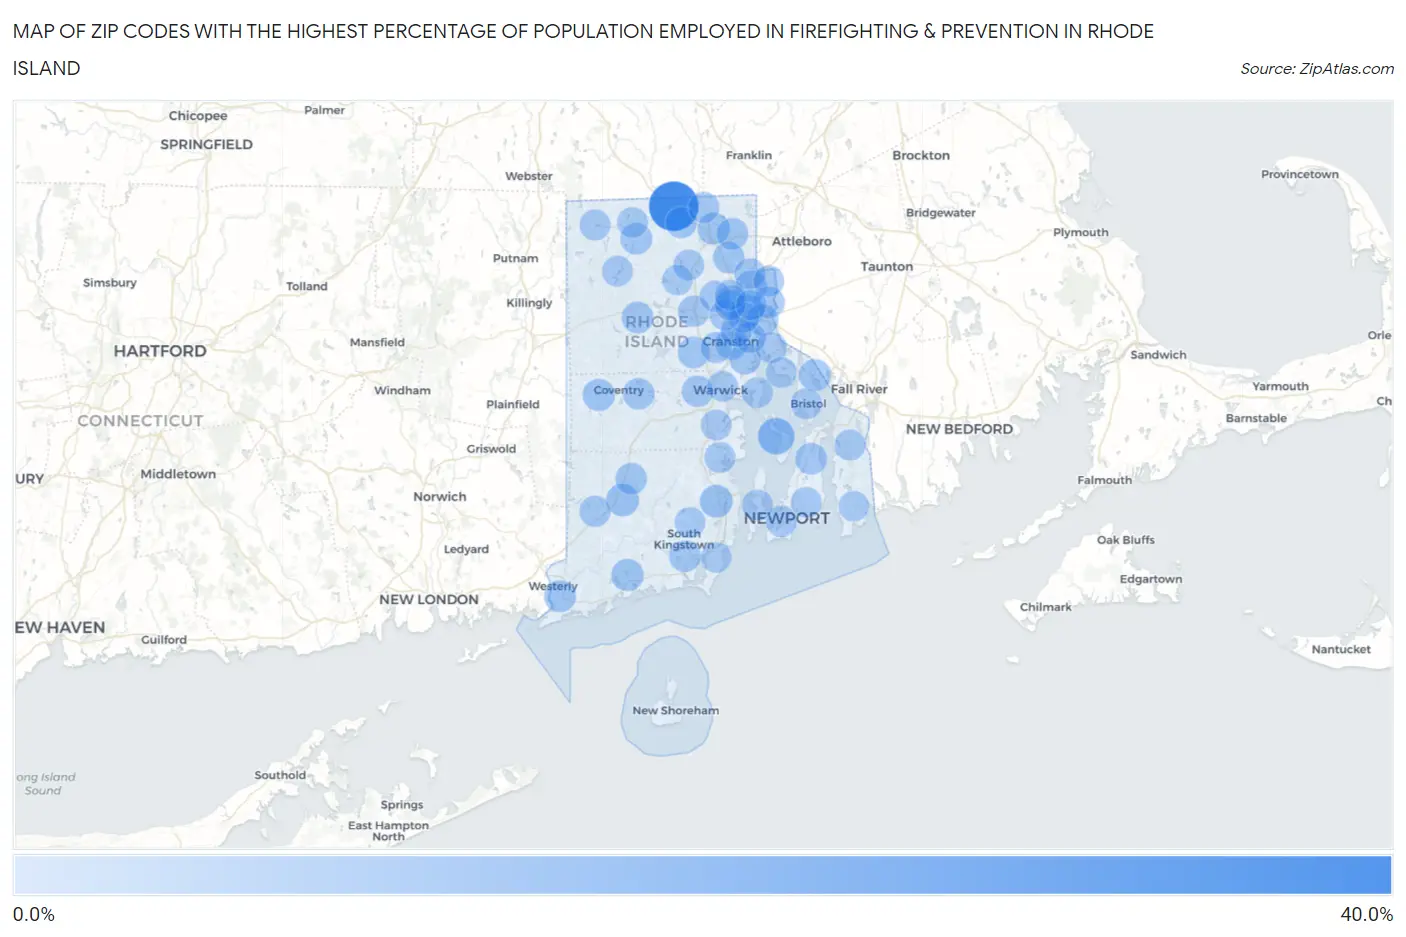
Map of Zip Codes with the Highest Percentage of Population Employed in Firefighting & Prevention in Rhode Island

0.0%
40.0%
Zip Codes with the Highest Percentage of Population Employed in Firefighting & Prevention in Rhode Island Map

Zip Codes with the Highest Percentage of Population Employed in Firefighting & Prevention in Rhode Island

Zip Code % Employed vs State vs National
1.0282435.7%1.5%(+34.2)#11.2%(+34.5)#36
2.0287211.1%1.5%(+9.57)#21.2%(+9.93)#263
3.028744.5%1.5%(+2.97)#31.2%(+3.32)#1,101
4.028984.2%1.5%(+2.67)#41.2%(+3.03)#1,250
5.028273.4%1.5%(+1.90)#51.2%(+2.26)#1,775
6.028133.4%1.5%(+1.86)#61.2%(+2.21)#1,809
7.028383.2%1.5%(+1.69)#71.2%(+2.04)#1,988
8.029103.1%1.5%(+1.59)#81.2%(+1.95)#2,101
9.028853.0%1.5%(+1.48)#91.2%(+1.83)#2,222
10.028913.0%1.5%(+1.42)#101.2%(+1.77)#2,304
11.029122.9%1.5%(+1.40)#111.2%(+1.75)#2,328
12.029212.7%1.5%(+1.20)#121.2%(+1.55)#2,667
13.028392.6%1.5%(+1.06)#131.2%(+1.41)#2,899
14.028572.6%1.5%(+1.06)#141.2%(+1.41)#2,901
15.028602.6%1.5%(+1.05)#151.2%(+1.40)#2,921
16.029142.5%1.5%(+0.974)#161.2%(+1.33)#3,063
17.029162.5%1.5%(+0.946)#171.2%(+1.30)#3,127
18.028712.5%1.5%(+0.941)#181.2%(+1.29)#3,139
19.028792.4%1.5%(+0.898)#191.2%(+1.25)#3,236
20.029182.4%1.5%(+0.875)#201.2%(+1.23)#3,296
21.028222.4%1.5%(+0.823)#211.2%(+1.18)#3,425
22.028642.3%1.5%(+0.765)#221.2%(+1.12)#3,549
23.028162.2%1.5%(+0.676)#231.2%(+1.03)#3,809
24.028962.2%1.5%(+0.616)#241.2%(+0.970)#4,000
25.028652.1%1.5%(+0.573)#251.2%(+0.928)#4,121
26.028882.1%1.5%(+0.546)#261.2%(+0.900)#4,197
27.028932.0%1.5%(+0.510)#271.2%(+0.864)#4,331
28.029192.0%1.5%(+0.431)#281.2%(+0.786)#4,620
29.028321.7%1.5%(+0.185)#291.2%(+0.540)#5,709
30.029201.5%1.5%(-0.042)#301.2%(+0.312)#6,983
31.029051.4%1.5%(-0.145)#311.2%(+0.209)#7,680
32.028631.3%1.5%(-0.216)#321.2%(+0.138)#8,163
33.028951.3%1.5%(-0.264)#331.2%(+0.090)#8,530
34.029151.3%1.5%(-0.265)#341.2%(+0.089)#8,548
35.028401.3%1.5%(-0.282)#351.2%(+0.072)#8,688
36.028591.2%1.5%(-0.324)#361.2%(+0.030)#9,012
37.029071.2%1.5%(-0.327)#371.2%(+0.027)#9,041
38.028891.2%1.5%(-0.390)#381.2%(-0.035)#9,617
39.028781.1%1.5%(-0.456)#391.2%(-0.102)#10,250
40.028521.1%1.5%(-0.469)#401.2%(-0.115)#10,373
41.028351.1%1.5%(-0.483)#411.2%(-0.129)#10,517
42.028141.0%1.5%(-0.502)#421.2%(-0.148)#10,703
43.028091.0%1.5%(-0.509)#431.2%(-0.154)#10,757
44.029111.0%1.5%(-0.516)#441.2%(-0.162)#10,839
45.028610.94%1.5%(-0.596)#451.2%(-0.242)#11,706
46.028860.91%1.5%(-0.630)#461.2%(-0.275)#12,051
47.029170.81%1.5%(-0.731)#471.2%(-0.377)#13,111
48.028180.80%1.5%(-0.741)#481.2%(-0.386)#13,220
49.028300.78%1.5%(-0.758)#491.2%(-0.403)#13,411
50.028420.78%1.5%(-0.762)#501.2%(-0.407)#13,451
51.029030.77%1.5%(-0.771)#511.2%(-0.417)#13,565
52.029090.77%1.5%(-0.771)#521.2%(-0.417)#13,566
53.029080.74%1.5%(-0.803)#531.2%(-0.449)#13,907
54.028810.57%1.5%(-0.969)#541.2%(-0.615)#15,729
55.029040.54%1.5%(-1.00)#551.2%(-0.648)#16,104
56.029060.53%1.5%(-1.01)#561.2%(-0.657)#16,223
57.028280.46%1.5%(-1.08)#571.2%(-0.723)#16,973
58.028060.44%1.5%(-1.10)#581.2%(-0.749)#17,246
59.028370.34%1.5%(-1.20)#591.2%(-0.849)#18,391
60.028820.30%1.5%(-1.24)#601.2%(-0.881)#18,717

Common Questions

What are the Top 10 Zip Codes with the Highest Percentage of Population Employed in Firefighting & Prevention in Rhode Island?
Top 10 Zip Codes with the Highest Percentage of Population Employed in Firefighting & Prevention in Rhode Island are:
#1
35.7%
#2
11.1%
#3
4.5%
#4
4.2%
#5
3.4%
#6
3.4%
#7
3.2%
#8
3.1%
#9
3.0%
#10
3.0%
What zip code has the Highest Percentage of Population Employed in Firefighting & Prevention in Rhode Island?
02824 has the Highest Percentage of Population Employed in Firefighting & Prevention in Rhode Island with 35.7%.
What is the Percentage of Population Employed in Firefighting & Prevention in the State of Rhode Island?
Percentage of Population Employed in Firefighting & Prevention in Rhode Island is 1.5%.
What is the Percentage of Population Employed in Firefighting & Prevention in the United States?
Percentage of Population Employed in Firefighting & Prevention in the United States is 1.2%.