Zip Codes with the Highest Percentage of Households Heated by Bottled Gas / Liquid Propane in Rhode Island

RELATED REPORTS & OPTIONS

Bottled Gas / LP Heating
Population
Families and Households
Female Fertility
Female Fertility (Unmarried)
Race (Community Size)
Race (Percentage)
Ancestry (Community Size)
AfghanAfricanAlaska NativeAlaskan AthabascanAlbanianAleutAlsatianAmericanApacheArabArapahoArgentineanArmenianAssyrian / Chaldean / SyriacAustralianAustrianBahamianBangladeshiBarbadianBasqueBelgianBelizeanBermudanBhutaneseBlackfeetBolivianBrazilianBritishBritish West IndianBulgarianBurmeseCajunCambodianCanadianCape VerdeanCarpatho RusynCelticCentral AmericanCentral American IndianCherokeeCheyenneChickasawChileanChineseChippewaChoctawColombianColvilleComancheCosta RicanCreeCreekCroatianCrowCubanCypriotCzechCzechoslovakianDanishDelawareDominicanDutchDutch West IndianEastern EuropeanEcuadorianEgyptianEnglishEstonianEthiopianEuropeanFijianFilipinoFinnishFrenchFrench American IndianFrench CanadianGermanGerman RussianGhanaianGreekGuamanian / ChamorroGuatemalanGuyaneseHaitianHmongHonduranHopiHoumaHungarianIcelanderIndian (Asian)IndonesianInupiatIranianIraqiIrishIroquoisIsraeliItalianJamaicanJapaneseJordanianKenyanKiowaKoreanLaotianLatvianLebaneseLiberianLithuanianLumbeeLuxembourgerMacedonianMalaysianMalteseMarshalleseMenomineeMexicanMexican American IndianMongolianMoroccanNative HawaiianNavajoNepaleseNew ZealanderNicaraguanNigerianNorthern EuropeanNorwegianOkinawanOsageOttawaPaiutePakistaniPalestinianPanamanianParaguayanPennsylvania GermanPeruvianPimaPolishPortuguesePotawatomiPuebloPuerto RicanPuget Sound SalishRomanianRussianSalvadoranSamoanScandinavianScotch-IrishScottishSeminoleSenegaleseSerbianShoshoneSierra LeoneanSiouxSlavicSlovakSloveneSomaliSouth AfricanSouth AmericanSouth American IndianSoviet UnionSpaniardSpanishSpanish AmericanSpanish American IndianSri LankanSubsaharan AfricanSudaneseSwedishSwissSyrianTaiwaneseThaiTlingit-HaidaTohono O'OdhamTonganTrinidadian and TobagonianTsimshianTurkishU.S. Virgin IslanderUgandanUkrainianUruguayanUteVenezuelanVietnameseWelshWest IndianYakamaYaquiYugoslavianYumanYup'ikZimbabwean
Ancestry (Percentage)
AfghanAfricanAlaska NativeAlaskan AthabascanAlbanianAleutAlsatianAmericanApacheArabArapahoArgentineanArmenianAssyrian / Chaldean / SyriacAustralianAustrianBahamianBangladeshiBarbadianBasqueBelgianBelizeanBermudanBhutaneseBlackfeetBolivianBrazilianBritishBritish West IndianBulgarianBurmeseCajunCambodianCanadianCape VerdeanCarpatho RusynCelticCentral AmericanCentral American IndianCherokeeCheyenneChickasawChileanChineseChippewaChoctawColombianColvilleComancheCosta RicanCreeCreekCroatianCrowCubanCypriotCzechCzechoslovakianDanishDelawareDominicanDutchDutch West IndianEastern EuropeanEcuadorianEgyptianEnglishEstonianEthiopianEuropeanFijianFilipinoFinnishFrenchFrench American IndianFrench CanadianGermanGerman RussianGhanaianGreekGuamanian / ChamorroGuatemalanGuyaneseHaitianHmongHonduranHopiHoumaHungarianIcelanderIndian (Asian)IndonesianInupiatIranianIraqiIrishIroquoisIsraeliItalianJamaicanJapaneseJordanianKenyanKiowaKoreanLaotianLatvianLebaneseLiberianLithuanianLumbeeLuxembourgerMacedonianMalaysianMalteseMarshalleseMenomineeMexicanMexican American IndianMongolianMoroccanNative HawaiianNavajoNepaleseNew ZealanderNicaraguanNigerianNorthern EuropeanNorwegianOkinawanOsageOttawaPaiutePakistaniPalestinianPanamanianParaguayanPennsylvania GermanPeruvianPimaPolishPortuguesePotawatomiPuebloPuerto RicanPuget Sound SalishRomanianRussianSalvadoranSamoanScandinavianScotch-IrishScottishSeminoleSenegaleseSerbianShoshoneSierra LeoneanSiouxSlavicSlovakSloveneSomaliSouth AfricanSouth AmericanSouth American IndianSoviet UnionSpaniardSpanishSpanish AmericanSpanish American IndianSri LankanSubsaharan AfricanSudaneseSwedishSwissSyrianTaiwaneseThaiTlingit-HaidaTohono O'OdhamTonganTrinidadian and TobagonianTsimshianTurkishU.S. Virgin IslanderUgandanUkrainianUruguayanUteVenezuelanVietnameseWelshWest IndianYakamaYaquiYugoslavianYumanYup'ikZimbabwean
Immigrant Origin (Total)
AfghanistanAfricaAlbaniaArgentinaArmeniaAsiaAustraliaAustriaAzoresBahamasBangladeshBarbadosBelarusBelgiumBelizeBoliviaBosnia and HerzegovinaBrazilBulgariaBurma / MyanmarCabo VerdeCambodiaCameroonCanadaCaribbeanCentral AmericaChileChinaColombiaCongoCosta RicaCroatiaCubaCzechoslovakiaDenmarkDominicaDominican RepublicEastern AfricaEastern AsiaEastern EuropeEcuadorEgyptEl SalvadorEnglandEritreaEthiopiaEuropeFijiFranceGermanyGhanaGreeceGrenadaGuatemalaGuyanaHaitiHondurasHong KongHungaryIndiaIndonesiaIranIraqIrelandIsraelItalyJamaicaJapanJordanKazakhstanKenyaKoreaKuwaitLaosLatin AmericaLatviaLebanonLiberiaLithuaniaMalaysiaMexicoMicronesiaMiddle AfricaMoldovaMoroccoNepalNetherlandsNicaraguaNigeriaNorth MacedoniaNorthern AfricaNorthern EuropeNorwayOceaniaPakistanPanamaPeruPhilippinesPolandPortugalRomaniaRussiaSaudi ArabiaScotlandSenegalSerbiaSierra LeoneSingaporeSomaliaSouth AfricaSouth AmericaSouth Central AsiaSouth Eastern AsiaSouthern EuropeSpainSri LankaSt. Vincent and the GrenadinesSudanSwedenSwitzerlandSyriaTaiwanThailandTrinidad and TobagoTurkeyUgandaUkraineUruguayUzbekistanVenezuelaVietnamWest IndiesWestern AfricaWestern AsiaWestern EuropeYemenZaireZimbabwe
Immigrant Origin (Percentage)
AfghanistanAfricaAlbaniaArgentinaArmeniaAsiaAustraliaAustriaAzoresBahamasBangladeshBarbadosBelarusBelgiumBelizeBoliviaBosnia and HerzegovinaBrazilBulgariaBurma / MyanmarCabo VerdeCambodiaCameroonCanadaCaribbeanCentral AmericaChileChinaColombiaCongoCosta RicaCroatiaCubaCzechoslovakiaDenmarkDominicaDominican RepublicEastern AfricaEastern AsiaEastern EuropeEcuadorEgyptEl SalvadorEnglandEritreaEthiopiaEuropeFijiFranceGermanyGhanaGreeceGrenadaGuatemalaGuyanaHaitiHondurasHong KongHungaryIndiaIndonesiaIranIraqIrelandIsraelItalyJamaicaJapanJordanKazakhstanKenyaKoreaKuwaitLaosLatin AmericaLatviaLebanonLiberiaLithuaniaMalaysiaMexicoMicronesiaMiddle AfricaMoldovaMoroccoNepalNetherlandsNicaraguaNigeriaNorth MacedoniaNorthern AfricaNorthern EuropeNorwayOceaniaPakistanPanamaPeruPhilippinesPolandPortugalRomaniaRussiaSaudi ArabiaScotlandSenegalSerbiaSierra LeoneSingaporeSomaliaSouth AfricaSouth AmericaSouth Central AsiaSouth Eastern AsiaSouthern EuropeSpainSri LankaSt. Vincent and the GrenadinesSudanSwedenSwitzerlandSyriaTaiwanThailandTrinidad and TobagoTurkeyUgandaUkraineUruguayUzbekistanVenezuelaVietnamWest IndiesWestern AfricaWestern AsiaWestern EuropeYemenZaireZimbabwe
Income
Income (Families)
Income (Households)
Poverty
Poverty (Families)
Unemployment
Employment Occupations
Employment Industries
Employer Class
Commute Time
Commute Means
School Enrollment
Education by Degree Field
Occupancy
Finances
Physical Characteristics
Rhode Island
Compare Zip Codes
Comparison Subject

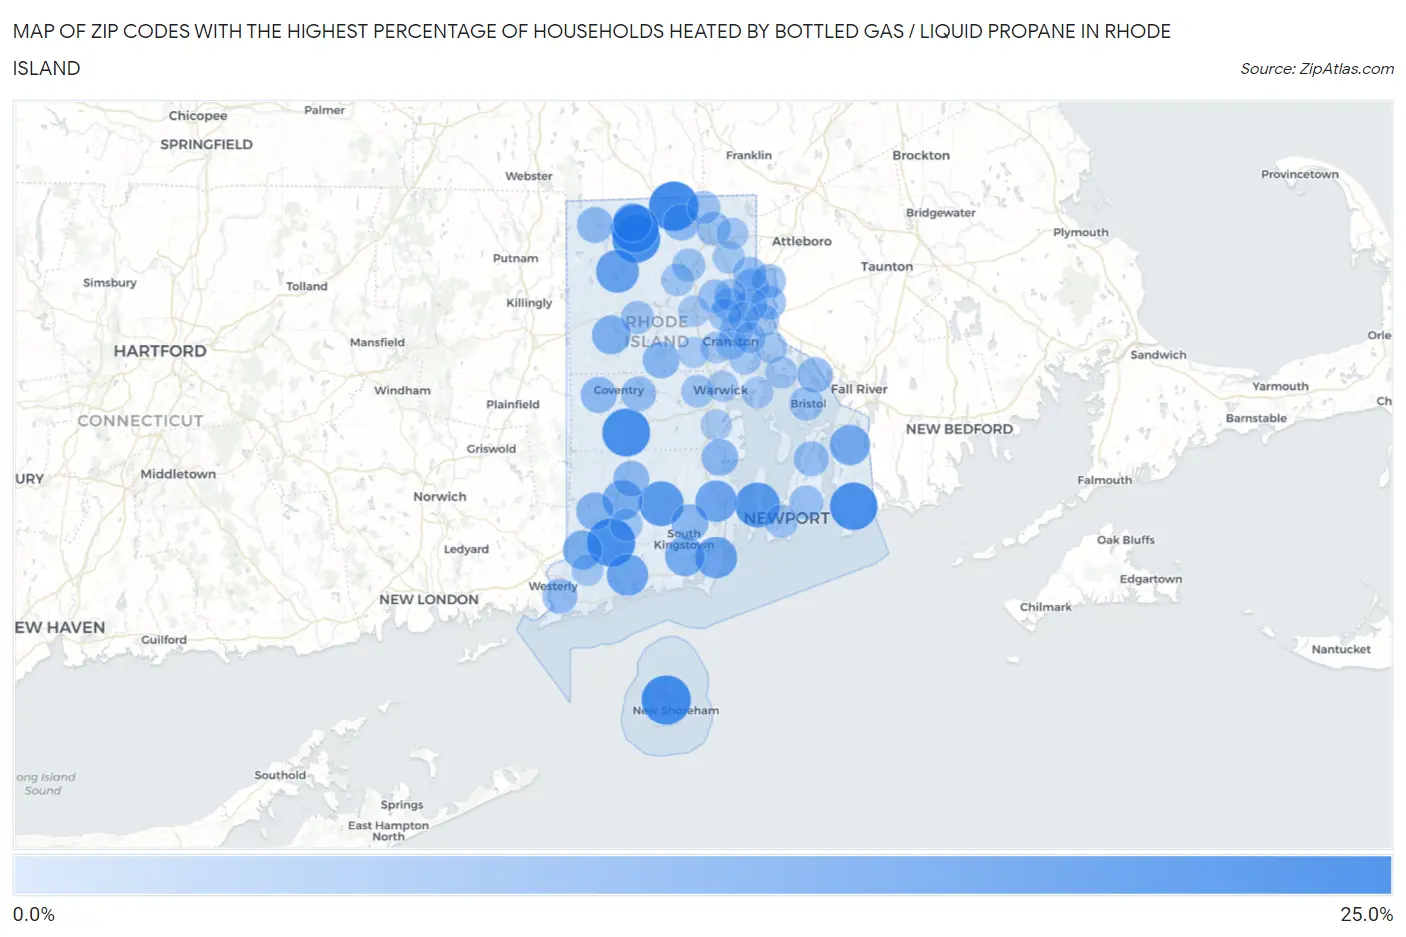
Map of Zip Codes with the Highest Percentage of Households Heated by Bottled Gas / Liquid Propane in Rhode Island

0.0%
25.0%
Zip Codes with the Highest Percentage of Households Heated by Bottled Gas / Liquid Propane in Rhode Island Map

Zip Codes with the Highest Percentage of Households Heated by Bottled Gas / Liquid Propane in Rhode Island

Zip Code Bottled Gas / LP Heating vs State vs National
1.0282421.4%4.3%(+17.1)#14.9%(+16.5)#8,426
2.0280721.1%4.3%(+16.8)#24.9%(+16.2)#8,546
3.0289419.8%4.3%(+15.5)#34.9%(+14.9)#9,034
4.0281719.6%4.3%(+15.3)#44.9%(+14.7)#9,098
5.0283919.6%4.3%(+15.3)#54.9%(+14.7)#9,108
6.0283719.3%4.3%(+15.0)#64.9%(+14.4)#9,220
7.0285819.2%4.3%(+14.9)#74.9%(+14.3)#9,282
8.0283516.3%4.3%(+12.0)#84.9%(+11.4)#10,648
9.0289216.1%4.3%(+11.8)#94.9%(+11.2)#10,743
10.0281414.0%4.3%(+9.70)#104.9%(+9.10)#11,851
11.0288212.8%4.3%(+8.50)#114.9%(+7.90)#12,520
12.0287412.5%4.3%(+8.20)#124.9%(+7.60)#12,738
13.0281312.4%4.3%(+8.10)#134.9%(+7.50)#12,807
14.0287811.1%4.3%(+6.80)#144.9%(+6.20)#13,683
15.0289810.7%4.3%(+6.40)#154.9%(+5.80)#13,972
16.0287910.5%4.3%(+6.20)#164.9%(+5.60)#14,082
17.028049.8%4.3%(+5.50)#174.9%(+4.90)#14,617
18.028309.4%4.3%(+5.10)#184.9%(+4.50)#14,877
19.028259.2%4.3%(+4.90)#194.9%(+4.30)#15,053
20.028328.0%4.3%(+3.70)#204.9%(+3.10)#15,963
21.028817.3%4.3%(+3.00)#214.9%(+2.40)#16,523
22.028317.2%4.3%(+2.90)#224.9%(+2.30)#16,616
23.028527.0%4.3%(+2.70)#234.9%(+2.10)#16,730
24.028966.4%4.3%(+2.10)#244.9%(+1.50)#17,250
25.028596.4%4.3%(+2.10)#254.9%(+1.50)#17,258
26.028226.4%4.3%(+2.10)#264.9%(+1.50)#17,262
27.028276.4%4.3%(+2.10)#274.9%(+1.50)#17,285
28.028855.7%4.3%(+1.40)#284.9%(+0.800)#17,841
29.028915.4%4.3%(+1.10)#294.9%(+0.500)#18,103
30.028715.2%4.3%(+0.900)#304.9%(+0.300)#18,323
31.028605.0%4.3%(+0.700)#314.9%(+0.100)#18,503
32.028164.9%4.3%(+0.600)#324.9%(=0.000)#18,617
33.029164.6%4.3%(+0.300)#334.9%(-0.300)#18,995
34.028614.4%4.3%(+0.100)#344.9%(-0.500)#19,182
35.028424.4%4.3%(+0.100)#354.9%(-0.500)#19,197
36.028384.3%4.3%(=0.000)#364.9%(-0.600)#19,363
37.028094.0%4.3%(-0.300)#374.9%(-0.900)#19,629
38.029083.8%4.3%(-0.500)#384.9%(-1.10)#19,847
39.028633.8%4.3%(-0.500)#394.9%(-1.10)#19,866
40.029113.7%4.3%(-0.600)#404.9%(-1.20)#20,001
41.029173.4%4.3%(-0.900)#414.9%(-1.50)#20,399
42.028953.3%4.3%(-1.000)#424.9%(-1.60)#20,516
43.028403.3%4.3%(-1.000)#434.9%(-1.60)#20,552
44.028573.3%4.3%(-1.000)#444.9%(-1.60)#20,584
45.029143.2%4.3%(-1.10)#454.9%(-1.70)#20,696
46.029073.1%4.3%(-1.20)#464.9%(-1.80)#20,847
47.029063.1%4.3%(-1.20)#474.9%(-1.80)#20,864
48.029093.0%4.3%(-1.30)#484.9%(-1.90)#20,991
49.028932.9%4.3%(-1.40)#494.9%(-2.00)#21,184
50.028282.7%4.3%(-1.60)#504.9%(-2.20)#21,610
51.028122.7%4.3%(-1.60)#514.9%(-2.20)#21,655
52.028652.4%4.3%(-1.90)#524.9%(-2.50)#22,213
53.028062.2%4.3%(-2.10)#534.9%(-2.70)#22,698
54.029042.1%4.3%(-2.20)#544.9%(-2.80)#22,874
55.028882.1%4.3%(-2.20)#554.9%(-2.80)#22,948
56.028642.0%4.3%(-2.30)#564.9%(-2.90)#23,151
57.029102.0%4.3%(-2.30)#574.9%(-2.90)#23,211
58.028081.9%4.3%(-2.40)#584.9%(-3.00)#23,612
59.029201.7%4.3%(-2.60)#594.9%(-3.20)#24,000
60.029151.7%4.3%(-2.60)#604.9%(-3.20)#24,118
61.029191.6%4.3%(-2.70)#614.9%(-3.30)#24,380
62.028861.5%4.3%(-2.80)#624.9%(-3.40)#24,727
63.028891.5%4.3%(-2.80)#634.9%(-3.40)#24,744
64.029051.3%4.3%(-3.00)#644.9%(-3.60)#25,509
65.028181.3%4.3%(-3.00)#654.9%(-3.60)#25,561
66.029211.1%4.3%(-3.20)#664.9%(-3.80)#26,386
67.029031.0%4.3%(-3.30)#674.9%(-3.90)#26,834

Common Questions

What are the Top 10 Zip Codes with the Highest Percentage of Households Heated by Bottled Gas / Liquid Propane in Rhode Island?
Top 10 Zip Codes with the Highest Percentage of Households Heated by Bottled Gas / Liquid Propane in Rhode Island are:
#1
21.4%
#2
21.1%
#3
19.8%
#4
19.6%
#5
19.6%
#6
19.3%
#7
19.2%
#8
16.3%
#9
16.1%
#10
14.0%
What zip code has the Highest Percentage of Households Heated by Bottled Gas / Liquid Propane in Rhode Island?
02824 has the Highest Percentage of Households Heated by Bottled Gas / Liquid Propane in Rhode Island with 21.4%.
What is the Percentage of Households Heated by Bottled Gas / Liquid Propane in the State of Rhode Island?
Percentage of Households Heated by Bottled Gas / Liquid Propane in Rhode Island is 4.3%.
What is the Percentage of Households Heated by Bottled Gas / Liquid Propane in the United States?
Percentage of Households Heated by Bottled Gas / Liquid Propane in the United States is 4.9%.