Zip Codes with the Highest Percentage of Population Employed in Education Instruction & Library in Rhode Island
RELATED REPORTS & OPTIONS
Education Instruction & Library
Rhode Island
Compare Zip Codes
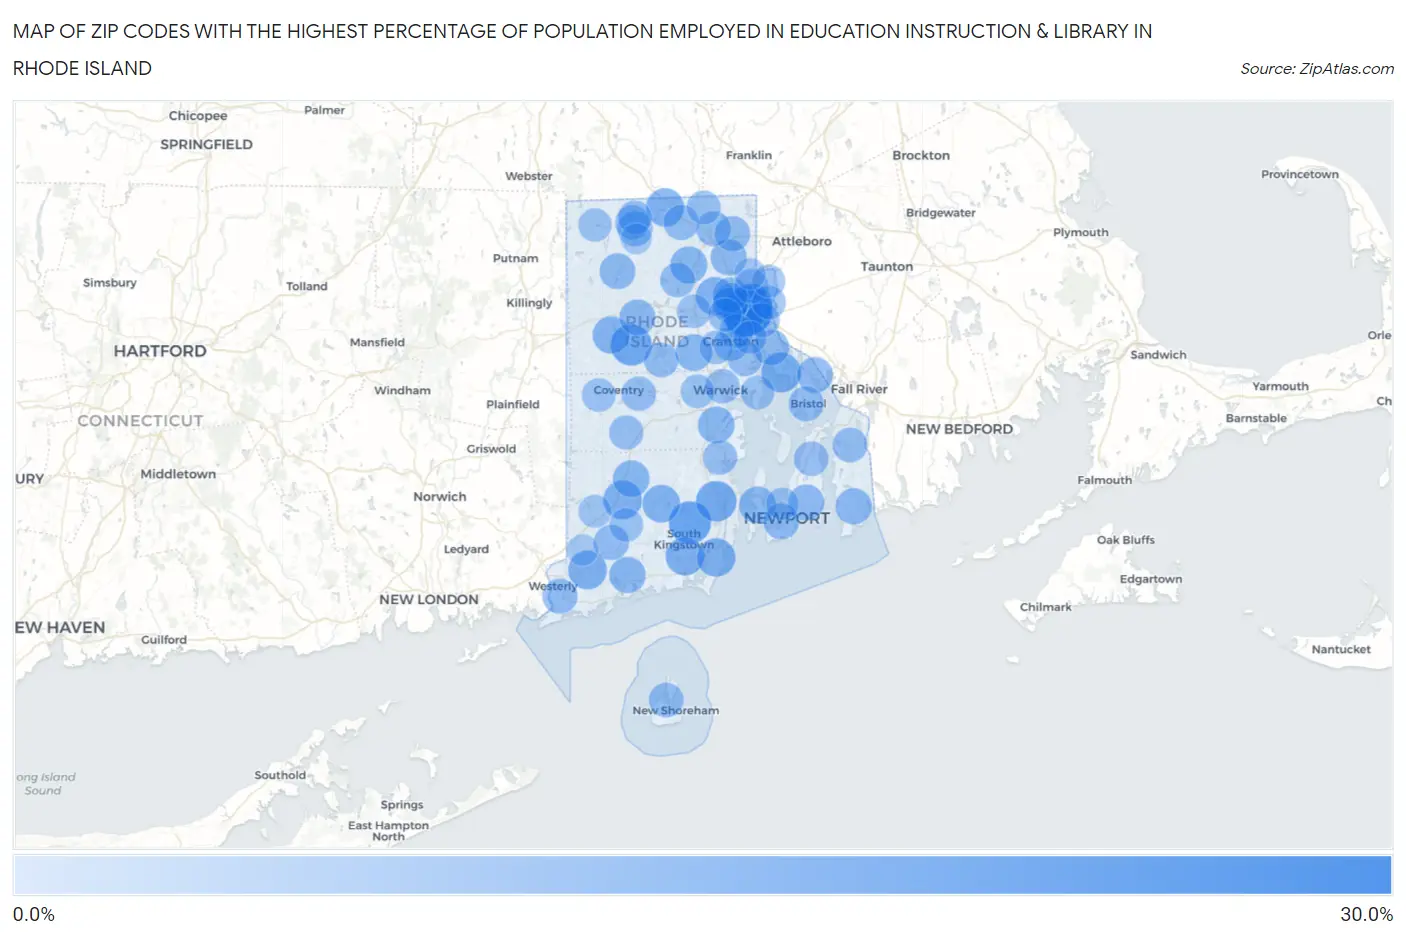
Map of Zip Codes with the Highest Percentage of Population Employed in Education Instruction & Library in Rhode Island
0.0%
30.0%
Zip Codes with the Highest Percentage of Population Employed in Education Instruction & Library in Rhode Island
| Zip Code | % Employed | vs State | vs National | |
| 1. | 02912 | 27.6% | 7.1%(+20.6)#1 | 6.2%(+21.4)#305 |
| 2. | 02906 | 17.4% | 7.1%(+10.3)#2 | 6.2%(+11.2)#904 |
| 3. | 02881 | 17.0% | 7.1%(+9.90)#3 | 6.2%(+10.8)#948 |
| 4. | 02815 | 15.7% | 7.1%(+8.60)#4 | 6.2%(+9.48)#1,159 |
| 5. | 02874 | 14.6% | 7.1%(+7.54)#5 | 6.2%(+8.42)#1,363 |
| 6. | 02806 | 13.5% | 7.1%(+6.41)#6 | 6.2%(+7.29)#1,718 |
| 7. | 02903 | 12.4% | 7.1%(+5.33)#7 | 6.2%(+6.20)#2,180 |
| 8. | 02898 | 11.9% | 7.1%(+4.86)#8 | 6.2%(+5.73)#2,428 |
| 9. | 02879 | 11.7% | 7.1%(+4.69)#9 | 6.2%(+5.57)#2,536 |
| 10. | 02808 | 11.7% | 7.1%(+4.67)#10 | 6.2%(+5.55)#2,545 |
| 11. | 02882 | 11.6% | 7.1%(+4.55)#11 | 6.2%(+5.43)#2,623 |
| 12. | 02876 | 11.3% | 7.1%(+4.23)#12 | 6.2%(+5.11)#2,853 |
| 13. | 02911 | 11.1% | 7.1%(+4.07)#13 | 6.2%(+4.95)#2,961 |
| 14. | 02892 | 10.5% | 7.1%(+3.47)#14 | 6.2%(+4.34)#3,429 |
| 15. | 02825 | 9.9% | 7.1%(+2.84)#15 | 6.2%(+3.71)#4,059 |
| 16. | 02917 | 9.5% | 7.1%(+2.47)#16 | 6.2%(+3.35)#4,483 |
| 17. | 02835 | 9.3% | 7.1%(+2.26)#17 | 6.2%(+3.14)#4,769 |
| 18. | 02921 | 9.2% | 7.1%(+2.11)#18 | 6.2%(+2.98)#4,974 |
| 19. | 02822 | 9.1% | 7.1%(+2.05)#19 | 6.2%(+2.93)#5,046 |
| 20. | 02818 | 9.0% | 7.1%(+1.96)#20 | 6.2%(+2.83)#5,201 |
| 21. | 02918 | 8.7% | 7.1%(+1.61)#21 | 6.2%(+2.49)#5,776 |
| 22. | 02813 | 8.5% | 7.1%(+1.49)#22 | 6.2%(+2.36)#6,012 |
| 23. | 02837 | 8.4% | 7.1%(+1.36)#23 | 6.2%(+2.23)#6,256 |
| 24. | 02842 | 8.2% | 7.1%(+1.18)#24 | 6.2%(+2.06)#6,625 |
| 25. | 02865 | 8.2% | 7.1%(+1.16)#25 | 6.2%(+2.04)#6,680 |
| 26. | 02857 | 8.1% | 7.1%(+1.06)#26 | 6.2%(+1.94)#6,879 |
| 27. | 02814 | 7.8% | 7.1%(+0.774)#27 | 6.2%(+1.65)#7,545 |
| 28. | 02885 | 7.8% | 7.1%(+0.719)#28 | 6.2%(+1.60)#7,692 |
| 29. | 02840 | 7.8% | 7.1%(+0.715)#29 | 6.2%(+1.59)#7,705 |
| 30. | 02915 | 7.8% | 7.1%(+0.713)#30 | 6.2%(+1.59)#7,711 |
| 31. | 02864 | 7.3% | 7.1%(+0.279)#31 | 6.2%(+1.16)#8,873 |
| 32. | 02908 | 7.2% | 7.1%(+0.161)#32 | 6.2%(+1.04)#9,236 |
| 33. | 02896 | 7.2% | 7.1%(+0.136)#33 | 6.2%(+1.01)#9,308 |
| 34. | 02894 | 7.1% | 7.1%(+0.051)#34 | 6.2%(+0.929)#9,538 |
| 35. | 02858 | 6.9% | 7.1%(-0.138)#35 | 6.2%(+0.740)#10,163 |
| 36. | 02809 | 6.8% | 7.1%(-0.294)#36 | 6.2%(+0.584)#10,686 |
| 37. | 02904 | 6.8% | 7.1%(-0.298)#37 | 6.2%(+0.580)#10,698 |
| 38. | 02891 | 6.8% | 7.1%(-0.306)#38 | 6.2%(+0.572)#10,719 |
| 39. | 02838 | 6.6% | 7.1%(-0.490)#39 | 6.2%(+0.388)#11,361 |
| 40. | 02831 | 6.4% | 7.1%(-0.669)#40 | 6.2%(+0.209)#12,004 |
| 41. | 02888 | 6.3% | 7.1%(-0.712)#41 | 6.2%(+0.165)#12,174 |
| 42. | 02878 | 6.3% | 7.1%(-0.738)#42 | 6.2%(+0.140)#12,264 |
| 43. | 02807 | 6.3% | 7.1%(-0.755)#43 | 6.2%(+0.123)#12,338 |
| 44. | 02828 | 6.2% | 7.1%(-0.820)#44 | 6.2%(+0.058)#12,610 |
| 45. | 02830 | 6.2% | 7.1%(-0.830)#45 | 6.2%(+0.048)#12,640 |
| 46. | 02910 | 6.2% | 7.1%(-0.863)#46 | 6.2%(+0.015)#12,763 |
| 47. | 02871 | 6.1% | 7.1%(-1.00)#47 | 6.2%(-0.123)#13,278 |
| 48. | 02816 | 5.9% | 7.1%(-1.13)#48 | 6.2%(-0.251)#13,760 |
| 49. | 02852 | 5.9% | 7.1%(-1.17)#49 | 6.2%(-0.295)#13,926 |
| 50. | 02886 | 5.9% | 7.1%(-1.18)#50 | 6.2%(-0.303)#13,976 |
| 51. | 02817 | 5.7% | 7.1%(-1.36)#51 | 6.2%(-0.479)#14,719 |
| 52. | 02860 | 5.7% | 7.1%(-1.36)#52 | 6.2%(-0.485)#14,748 |
| 53. | 02914 | 5.7% | 7.1%(-1.38)#53 | 6.2%(-0.506)#14,837 |
| 54. | 02907 | 5.4% | 7.1%(-1.63)#54 | 6.2%(-0.750)#15,838 |
| 55. | 02895 | 5.2% | 7.1%(-1.88)#55 | 6.2%(-1.00)#16,855 |
| 56. | 02826 | 5.1% | 7.1%(-1.91)#56 | 6.2%(-1.04)#16,993 |
| 57. | 02919 | 5.1% | 7.1%(-2.01)#57 | 6.2%(-1.13)#17,423 |
| 58. | 02916 | 5.0% | 7.1%(-2.05)#58 | 6.2%(-1.17)#17,584 |
| 59. | 02893 | 5.0% | 7.1%(-2.08)#59 | 6.2%(-1.21)#17,743 |
| 60. | 02827 | 4.9% | 7.1%(-2.19)#60 | 6.2%(-1.31)#18,173 |
| 61. | 02889 | 4.8% | 7.1%(-2.23)#61 | 6.2%(-1.36)#18,373 |
| 62. | 02812 | 4.8% | 7.1%(-2.28)#62 | 6.2%(-1.40)#18,562 |
| 63. | 02909 | 4.7% | 7.1%(-2.35)#63 | 6.2%(-1.47)#18,868 |
| 64. | 02920 | 4.6% | 7.1%(-2.50)#64 | 6.2%(-1.62)#19,480 |
| 65. | 02859 | 4.5% | 7.1%(-2.55)#65 | 6.2%(-1.67)#19,684 |
| 66. | 02905 | 4.1% | 7.1%(-2.93)#66 | 6.2%(-2.05)#21,166 |
| 67. | 02832 | 3.9% | 7.1%(-3.11)#67 | 6.2%(-2.23)#21,848 |
| 68. | 02861 | 3.7% | 7.1%(-3.35)#68 | 6.2%(-2.47)#22,673 |
| 69. | 02841 | 3.1% | 7.1%(-3.96)#69 | 6.2%(-3.08)#24,587 |
| 70. | 02804 | 1.8% | 7.1%(-5.23)#70 | 6.2%(-4.35)#27,204 |
| 71. | 02863 | 1.7% | 7.1%(-5.37)#71 | 6.2%(-4.50)#27,416 |
| 72. | 02839 | 1.1% | 7.1%(-5.96)#72 | 6.2%(-5.08)#28,139 |
1
Common Questions
What are the Top 10 Zip Codes with the Highest Percentage of Population Employed in Education Instruction & Library in Rhode Island?
Top 10 Zip Codes with the Highest Percentage of Population Employed in Education Instruction & Library in Rhode Island are:
What zip code has the Highest Percentage of Population Employed in Education Instruction & Library in Rhode Island?
02912 has the Highest Percentage of Population Employed in Education Instruction & Library in Rhode Island with 27.6%.
What is the Percentage of Population Employed in Education Instruction & Library in the State of Rhode Island?
Percentage of Population Employed in Education Instruction & Library in Rhode Island is 7.1%.
What is the Percentage of Population Employed in Education Instruction & Library in the United States?
Percentage of Population Employed in Education Instruction & Library in the United States is 6.2%.