Zip Codes with the Highest Percentage of Population Employed in Security & Protection in Warwick, RI
RELATED REPORTS & OPTIONS
Security & Protection
Warwick
Compare Zip Codes
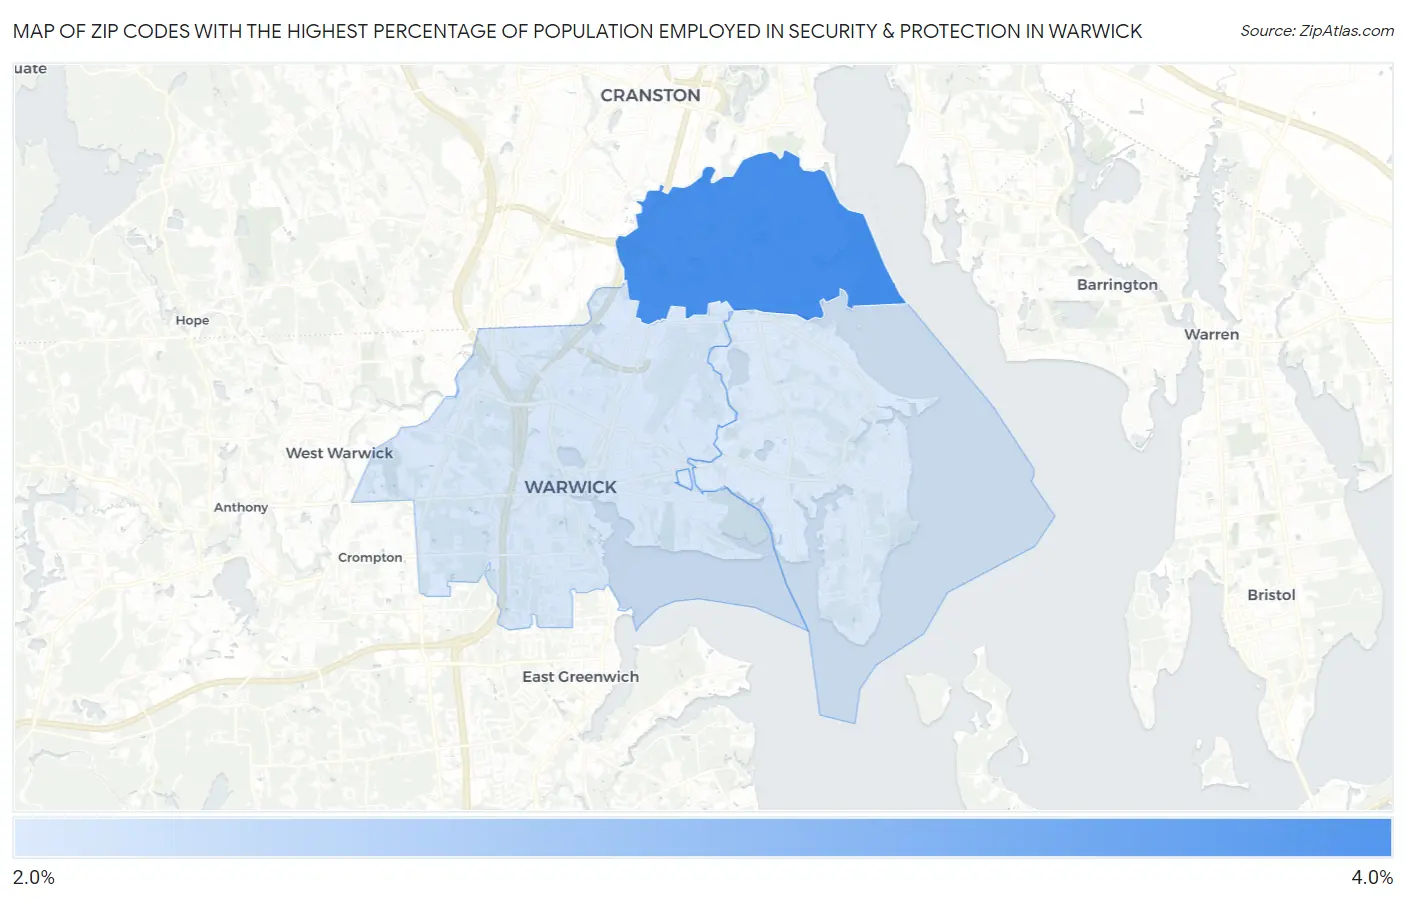
Map of Zip Codes with the Highest Percentage of Population Employed in Security & Protection in Warwick
2.8%
3.8%
Zip Codes with the Highest Percentage of Population Employed in Security & Protection in Warwick, RI
| Zip Code | % Employed | vs State | vs National | |
| 1. | 02888 | 3.8% | 2.4%(+1.39)#14 | 2.1%(+1.68)#4,851 |
| 2. | 02886 | 2.8% | 2.4%(+0.408)#27 | 2.1%(+0.695)#7,897 |
| 3. | 02889 | 2.8% | 2.4%(+0.381)#28 | 2.1%(+0.668)#8,044 |
1
Common Questions
What are the Top Zip Codes with the Highest Percentage of Population Employed in Security & Protection in Warwick, RI?
Top Zip Codes with the Highest Percentage of Population Employed in Security & Protection in Warwick, RI are:
What zip code has the Highest Percentage of Population Employed in Security & Protection in Warwick, RI?
02888 has the Highest Percentage of Population Employed in Security & Protection in Warwick, RI with 3.8%.
What is the Percentage of Population Employed in Security & Protection in Warwick, RI?
Percentage of Population Employed in Security & Protection in Warwick is 3.0%.
What is the Percentage of Population Employed in Security & Protection in Rhode Island?
Percentage of Population Employed in Security & Protection in Rhode Island is 2.4%.
What is the Percentage of Population Employed in Security & Protection in the United States?
Percentage of Population Employed in Security & Protection in the United States is 2.1%.