Zip Codes with the Highest Percentage of Population with a Degree in Business in Rhode Island
RELATED REPORTS & OPTIONS
Business
Rhode Island
Compare Zip Codes
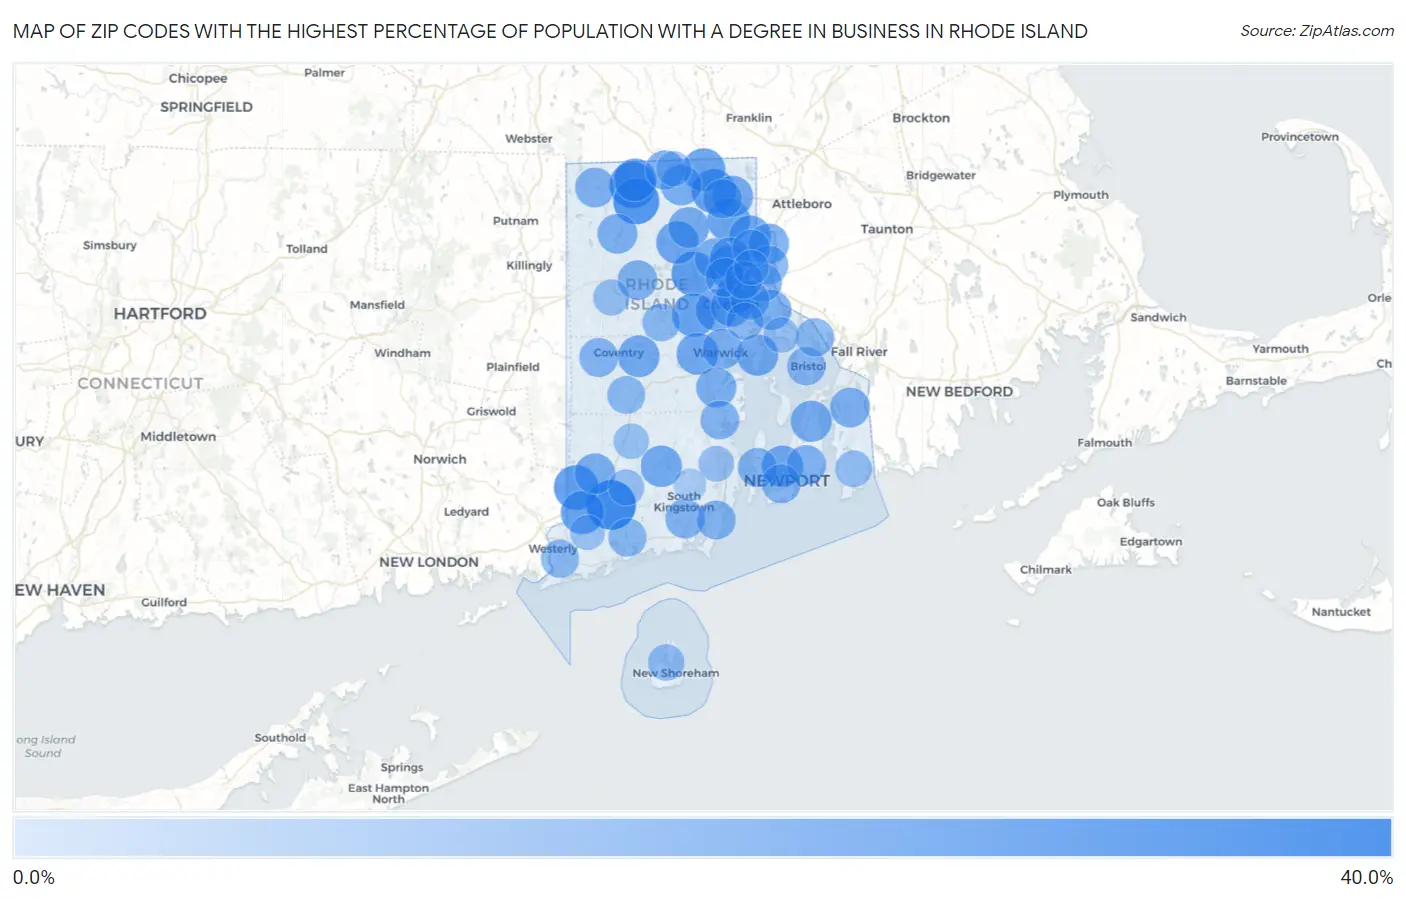
Map of Zip Codes with the Highest Percentage of Population with a Degree in Business in Rhode Island
0.0%
40.0%
Zip Codes with the Highest Percentage of Population with a Degree in Business in Rhode Island
| Zip Code | % Graduates | vs State | vs National | |
| 1. | 02894 | 35.8% | 17.4%(+18.4)#1 | 19.5%(+16.3)#1,623 |
| 2. | 02830 | 29.6% | 17.4%(+12.2)#2 | 19.5%(+10.1)#2,969 |
| 3. | 02839 | 29.4% | 17.4%(+11.9)#3 | 19.5%(+9.85)#3,072 |
| 4. | 02833 | 26.8% | 17.4%(+9.36)#4 | 19.5%(+7.29)#4,328 |
| 5. | 02919 | 26.3% | 17.4%(+8.87)#5 | 19.5%(+6.80)#4,683 |
| 6. | 02838 | 25.9% | 17.4%(+8.51)#6 | 19.5%(+6.44)#4,920 |
| 7. | 02921 | 24.6% | 17.4%(+7.15)#7 | 19.5%(+5.07)#6,052 |
| 8. | 02895 | 24.2% | 17.4%(+6.72)#8 | 19.5%(+4.65)#6,461 |
| 9. | 02804 | 24.1% | 17.4%(+6.70)#9 | 19.5%(+4.63)#6,487 |
| 10. | 02908 | 23.8% | 17.4%(+6.37)#10 | 19.5%(+4.30)#6,816 |
| 11. | 02865 | 23.5% | 17.4%(+6.10)#11 | 19.5%(+4.03)#7,103 |
| 12. | 02826 | 23.1% | 17.4%(+5.65)#12 | 19.5%(+3.58)#7,586 |
| 13. | 02828 | 22.8% | 17.4%(+5.38)#13 | 19.5%(+3.31)#7,852 |
| 14. | 02893 | 21.4% | 17.4%(+3.95)#14 | 19.5%(+1.88)#9,645 |
| 15. | 02863 | 21.3% | 17.4%(+3.88)#15 | 19.5%(+1.81)#9,732 |
| 16. | 02816 | 21.0% | 17.4%(+3.58)#16 | 19.5%(+1.51)#10,145 |
| 17. | 02889 | 20.8% | 17.4%(+3.39)#17 | 19.5%(+1.32)#10,422 |
| 18. | 02892 | 20.8% | 17.4%(+3.39)#18 | 19.5%(+1.32)#10,424 |
| 19. | 02920 | 20.8% | 17.4%(+3.39)#19 | 19.5%(+1.32)#10,430 |
| 20. | 02841 | 20.6% | 17.4%(+3.13)#20 | 19.5%(+1.06)#10,801 |
| 21. | 02864 | 20.3% | 17.4%(+2.86)#21 | 19.5%(+0.787)#11,189 |
| 22. | 02871 | 20.2% | 17.4%(+2.73)#22 | 19.5%(+0.663)#11,356 |
| 23. | 02910 | 19.8% | 17.4%(+2.33)#23 | 19.5%(+0.261)#11,985 |
| 24. | 02917 | 19.5% | 17.4%(+2.11)#24 | 19.5%(+0.039)#12,307 |
| 25. | 02896 | 19.3% | 17.4%(+1.88)#25 | 19.5%(-0.192)#12,644 |
| 26. | 02911 | 19.3% | 17.4%(+1.83)#26 | 19.5%(-0.237)#12,715 |
| 27. | 02832 | 19.1% | 17.4%(+1.69)#27 | 19.5%(-0.377)#12,949 |
| 28. | 02861 | 18.9% | 17.4%(+1.49)#28 | 19.5%(-0.583)#13,265 |
| 29. | 02886 | 18.6% | 17.4%(+1.15)#29 | 19.5%(-0.918)#13,730 |
| 30. | 02904 | 18.5% | 17.4%(+1.11)#30 | 19.5%(-0.963)#13,801 |
| 31. | 02818 | 18.3% | 17.4%(+0.869)#31 | 19.5%(-1.20)#14,133 |
| 32. | 02915 | 18.2% | 17.4%(+0.744)#32 | 19.5%(-1.33)#14,344 |
| 33. | 02814 | 17.9% | 17.4%(+0.474)#33 | 19.5%(-1.60)#14,719 |
| 34. | 02878 | 17.7% | 17.4%(+0.274)#34 | 19.5%(-1.80)#15,031 |
| 35. | 02859 | 17.3% | 17.4%(-0.086)#35 | 19.5%(-2.16)#15,585 |
| 36. | 02842 | 17.3% | 17.4%(-0.111)#36 | 19.5%(-2.18)#15,625 |
| 37. | 02857 | 17.1% | 17.4%(-0.347)#37 | 19.5%(-2.42)#16,000 |
| 38. | 02876 | 17.0% | 17.4%(-0.407)#38 | 19.5%(-2.48)#16,120 |
| 39. | 02879 | 16.5% | 17.4%(-0.976)#39 | 19.5%(-3.05)#16,966 |
| 40. | 02907 | 16.5% | 17.4%(-0.976)#40 | 19.5%(-3.05)#16,967 |
| 41. | 02802 | 16.3% | 17.4%(-1.11)#41 | 19.5%(-3.18)#17,157 |
| 42. | 02835 | 16.3% | 17.4%(-1.17)#42 | 19.5%(-3.24)#17,236 |
| 43. | 02827 | 16.2% | 17.4%(-1.18)#43 | 19.5%(-3.25)#17,250 |
| 44. | 02882 | 16.1% | 17.4%(-1.29)#44 | 19.5%(-3.36)#17,410 |
| 45. | 02916 | 16.1% | 17.4%(-1.33)#45 | 19.5%(-3.40)#17,464 |
| 46. | 02840 | 16.0% | 17.4%(-1.43)#46 | 19.5%(-3.50)#17,591 |
| 47. | 02909 | 16.0% | 17.4%(-1.45)#47 | 19.5%(-3.52)#17,619 |
| 48. | 02914 | 15.9% | 17.4%(-1.50)#48 | 19.5%(-3.57)#17,694 |
| 49. | 02905 | 15.9% | 17.4%(-1.55)#49 | 19.5%(-3.62)#17,749 |
| 50. | 02852 | 15.7% | 17.4%(-1.69)#50 | 19.5%(-3.76)#17,939 |
| 51. | 02809 | 15.1% | 17.4%(-2.30)#51 | 19.5%(-4.37)#18,802 |
| 52. | 02885 | 14.9% | 17.4%(-2.50)#52 | 19.5%(-4.57)#19,067 |
| 53. | 02813 | 14.6% | 17.4%(-2.80)#53 | 19.5%(-4.87)#19,440 |
| 54. | 02860 | 14.5% | 17.4%(-2.88)#54 | 19.5%(-4.95)#19,549 |
| 55. | 02891 | 14.5% | 17.4%(-2.97)#55 | 19.5%(-5.04)#19,651 |
| 56. | 02817 | 14.1% | 17.4%(-3.37)#56 | 19.5%(-5.44)#20,165 |
| 57. | 02831 | 14.0% | 17.4%(-3.46)#57 | 19.5%(-5.53)#20,279 |
| 58. | 02903 | 13.8% | 17.4%(-3.64)#58 | 19.5%(-5.71)#20,505 |
| 59. | 02888 | 12.9% | 17.4%(-4.49)#59 | 19.5%(-6.56)#21,513 |
| 60. | 02837 | 11.8% | 17.4%(-5.60)#60 | 19.5%(-7.67)#22,673 |
| 61. | 02807 | 11.5% | 17.4%(-5.94)#61 | 19.5%(-8.01)#22,989 |
| 62. | 02812 | 11.0% | 17.4%(-6.46)#62 | 19.5%(-8.53)#23,499 |
| 63. | 02825 | 10.9% | 17.4%(-6.58)#63 | 19.5%(-8.65)#23,607 |
| 64. | 02874 | 10.3% | 17.4%(-7.11)#64 | 19.5%(-9.18)#24,099 |
| 65. | 02822 | 9.8% | 17.4%(-7.67)#65 | 19.5%(-9.74)#24,534 |
| 66. | 02806 | 9.7% | 17.4%(-7.76)#66 | 19.5%(-9.83)#24,612 |
| 67. | 02824 | 9.2% | 17.4%(-8.19)#67 | 19.5%(-10.3)#24,947 |
| 68. | 02906 | 8.9% | 17.4%(-8.55)#68 | 19.5%(-10.6)#25,246 |
| 69. | 02808 | 8.8% | 17.4%(-8.61)#69 | 19.5%(-10.7)#25,278 |
| 70. | 02881 | 4.8% | 17.4%(-12.6)#70 | 19.5%(-14.7)#27,505 |
1
Common Questions
What are the Top 10 Zip Codes with the Highest Percentage of Population with a Degree in Business in Rhode Island?
Top 10 Zip Codes with the Highest Percentage of Population with a Degree in Business in Rhode Island are:
What zip code has the Highest Percentage of Population with a Degree in Business in Rhode Island?
02894 has the Highest Percentage of Population with a Degree in Business in Rhode Island with 35.8%.
What is the Percentage of Population with a Degree in Business in the State of Rhode Island?
Percentage of Population with a Degree in Business in Rhode Island is 17.4%.
What is the Percentage of Population with a Degree in Business in the United States?
Percentage of Population with a Degree in Business in the United States is 19.5%.