Zip Codes with the Highest Percentage of Population with a Degree in Education in Rhode Island

RELATED REPORTS & OPTIONS

Education
Population
Families and Households
Female Fertility
Female Fertility (Unmarried)
Race (Community Size)
Race (Percentage)
Ancestry (Community Size)
AfghanAfricanAlaska NativeAlaskan AthabascanAlbanianAleutAlsatianAmericanApacheArabArapahoArgentineanArmenianAssyrian / Chaldean / SyriacAustralianAustrianBahamianBangladeshiBarbadianBasqueBelgianBelizeanBermudanBhutaneseBlackfeetBolivianBrazilianBritishBritish West IndianBulgarianBurmeseCajunCambodianCanadianCape VerdeanCarpatho RusynCelticCentral AmericanCentral American IndianCherokeeCheyenneChickasawChileanChineseChippewaChoctawColombianColvilleComancheCosta RicanCreeCreekCroatianCrowCubanCypriotCzechCzechoslovakianDanishDelawareDominicanDutchDutch West IndianEastern EuropeanEcuadorianEgyptianEnglishEstonianEthiopianEuropeanFijianFilipinoFinnishFrenchFrench American IndianFrench CanadianGermanGerman RussianGhanaianGreekGuamanian / ChamorroGuatemalanGuyaneseHaitianHmongHonduranHopiHoumaHungarianIcelanderIndian (Asian)IndonesianInupiatIranianIraqiIrishIroquoisIsraeliItalianJamaicanJapaneseJordanianKenyanKiowaKoreanLaotianLatvianLebaneseLiberianLithuanianLumbeeLuxembourgerMacedonianMalaysianMalteseMarshalleseMenomineeMexicanMexican American IndianMongolianMoroccanNative HawaiianNavajoNepaleseNew ZealanderNicaraguanNigerianNorthern EuropeanNorwegianOkinawanOsageOttawaPaiutePakistaniPalestinianPanamanianParaguayanPennsylvania GermanPeruvianPimaPolishPortuguesePotawatomiPuebloPuerto RicanPuget Sound SalishRomanianRussianSalvadoranSamoanScandinavianScotch-IrishScottishSeminoleSenegaleseSerbianShoshoneSierra LeoneanSiouxSlavicSlovakSloveneSomaliSouth AfricanSouth AmericanSouth American IndianSoviet UnionSpaniardSpanishSpanish AmericanSpanish American IndianSri LankanSubsaharan AfricanSudaneseSwedishSwissSyrianTaiwaneseThaiTlingit-HaidaTohono O'OdhamTonganTrinidadian and TobagonianTsimshianTurkishU.S. Virgin IslanderUgandanUkrainianUruguayanUteVenezuelanVietnameseWelshWest IndianYakamaYaquiYugoslavianYumanYup'ikZimbabwean
Ancestry (Percentage)
AfghanAfricanAlaska NativeAlaskan AthabascanAlbanianAleutAlsatianAmericanApacheArabArapahoArgentineanArmenianAssyrian / Chaldean / SyriacAustralianAustrianBahamianBangladeshiBarbadianBasqueBelgianBelizeanBermudanBhutaneseBlackfeetBolivianBrazilianBritishBritish West IndianBulgarianBurmeseCajunCambodianCanadianCape VerdeanCarpatho RusynCelticCentral AmericanCentral American IndianCherokeeCheyenneChickasawChileanChineseChippewaChoctawColombianColvilleComancheCosta RicanCreeCreekCroatianCrowCubanCypriotCzechCzechoslovakianDanishDelawareDominicanDutchDutch West IndianEastern EuropeanEcuadorianEgyptianEnglishEstonianEthiopianEuropeanFijianFilipinoFinnishFrenchFrench American IndianFrench CanadianGermanGerman RussianGhanaianGreekGuamanian / ChamorroGuatemalanGuyaneseHaitianHmongHonduranHopiHoumaHungarianIcelanderIndian (Asian)IndonesianInupiatIranianIraqiIrishIroquoisIsraeliItalianJamaicanJapaneseJordanianKenyanKiowaKoreanLaotianLatvianLebaneseLiberianLithuanianLumbeeLuxembourgerMacedonianMalaysianMalteseMarshalleseMenomineeMexicanMexican American IndianMongolianMoroccanNative HawaiianNavajoNepaleseNew ZealanderNicaraguanNigerianNorthern EuropeanNorwegianOkinawanOsageOttawaPaiutePakistaniPalestinianPanamanianParaguayanPennsylvania GermanPeruvianPimaPolishPortuguesePotawatomiPuebloPuerto RicanPuget Sound SalishRomanianRussianSalvadoranSamoanScandinavianScotch-IrishScottishSeminoleSenegaleseSerbianShoshoneSierra LeoneanSiouxSlavicSlovakSloveneSomaliSouth AfricanSouth AmericanSouth American IndianSoviet UnionSpaniardSpanishSpanish AmericanSpanish American IndianSri LankanSubsaharan AfricanSudaneseSwedishSwissSyrianTaiwaneseThaiTlingit-HaidaTohono O'OdhamTonganTrinidadian and TobagonianTsimshianTurkishU.S. Virgin IslanderUgandanUkrainianUruguayanUteVenezuelanVietnameseWelshWest IndianYakamaYaquiYugoslavianYumanYup'ikZimbabwean
Immigrant Origin (Total)
AfghanistanAfricaAlbaniaArgentinaArmeniaAsiaAustraliaAustriaAzoresBahamasBangladeshBarbadosBelarusBelgiumBelizeBoliviaBosnia and HerzegovinaBrazilBulgariaBurma / MyanmarCabo VerdeCambodiaCameroonCanadaCaribbeanCentral AmericaChileChinaColombiaCongoCosta RicaCroatiaCubaCzechoslovakiaDenmarkDominicaDominican RepublicEastern AfricaEastern AsiaEastern EuropeEcuadorEgyptEl SalvadorEnglandEritreaEthiopiaEuropeFijiFranceGermanyGhanaGreeceGrenadaGuatemalaGuyanaHaitiHondurasHong KongHungaryIndiaIndonesiaIranIraqIrelandIsraelItalyJamaicaJapanJordanKazakhstanKenyaKoreaKuwaitLaosLatin AmericaLatviaLebanonLiberiaLithuaniaMalaysiaMexicoMicronesiaMiddle AfricaMoldovaMoroccoNepalNetherlandsNicaraguaNigeriaNorth MacedoniaNorthern AfricaNorthern EuropeNorwayOceaniaPakistanPanamaPeruPhilippinesPolandPortugalRomaniaRussiaSaudi ArabiaScotlandSenegalSerbiaSierra LeoneSingaporeSomaliaSouth AfricaSouth AmericaSouth Central AsiaSouth Eastern AsiaSouthern EuropeSpainSri LankaSt. Vincent and the GrenadinesSudanSwedenSwitzerlandSyriaTaiwanThailandTrinidad and TobagoTurkeyUgandaUkraineUruguayUzbekistanVenezuelaVietnamWest IndiesWestern AfricaWestern AsiaWestern EuropeYemenZaireZimbabwe
Immigrant Origin (Percentage)
AfghanistanAfricaAlbaniaArgentinaArmeniaAsiaAustraliaAustriaAzoresBahamasBangladeshBarbadosBelarusBelgiumBelizeBoliviaBosnia and HerzegovinaBrazilBulgariaBurma / MyanmarCabo VerdeCambodiaCameroonCanadaCaribbeanCentral AmericaChileChinaColombiaCongoCosta RicaCroatiaCubaCzechoslovakiaDenmarkDominicaDominican RepublicEastern AfricaEastern AsiaEastern EuropeEcuadorEgyptEl SalvadorEnglandEritreaEthiopiaEuropeFijiFranceGermanyGhanaGreeceGrenadaGuatemalaGuyanaHaitiHondurasHong KongHungaryIndiaIndonesiaIranIraqIrelandIsraelItalyJamaicaJapanJordanKazakhstanKenyaKoreaKuwaitLaosLatin AmericaLatviaLebanonLiberiaLithuaniaMalaysiaMexicoMicronesiaMiddle AfricaMoldovaMoroccoNepalNetherlandsNicaraguaNigeriaNorth MacedoniaNorthern AfricaNorthern EuropeNorwayOceaniaPakistanPanamaPeruPhilippinesPolandPortugalRomaniaRussiaSaudi ArabiaScotlandSenegalSerbiaSierra LeoneSingaporeSomaliaSouth AfricaSouth AmericaSouth Central AsiaSouth Eastern AsiaSouthern EuropeSpainSri LankaSt. Vincent and the GrenadinesSudanSwedenSwitzerlandSyriaTaiwanThailandTrinidad and TobagoTurkeyUgandaUkraineUruguayUzbekistanVenezuelaVietnamWest IndiesWestern AfricaWestern AsiaWestern EuropeYemenZaireZimbabwe
Income
Income (Families)
Income (Households)
Poverty
Poverty (Families)
Unemployment
Employment Occupations
Employment Industries
Employer Class
Commute Time
Commute Means
School Enrollment
Education by Degree Field
Occupancy
Finances
Physical Characteristics
Rhode Island
Compare Zip Codes
Comparison Subject

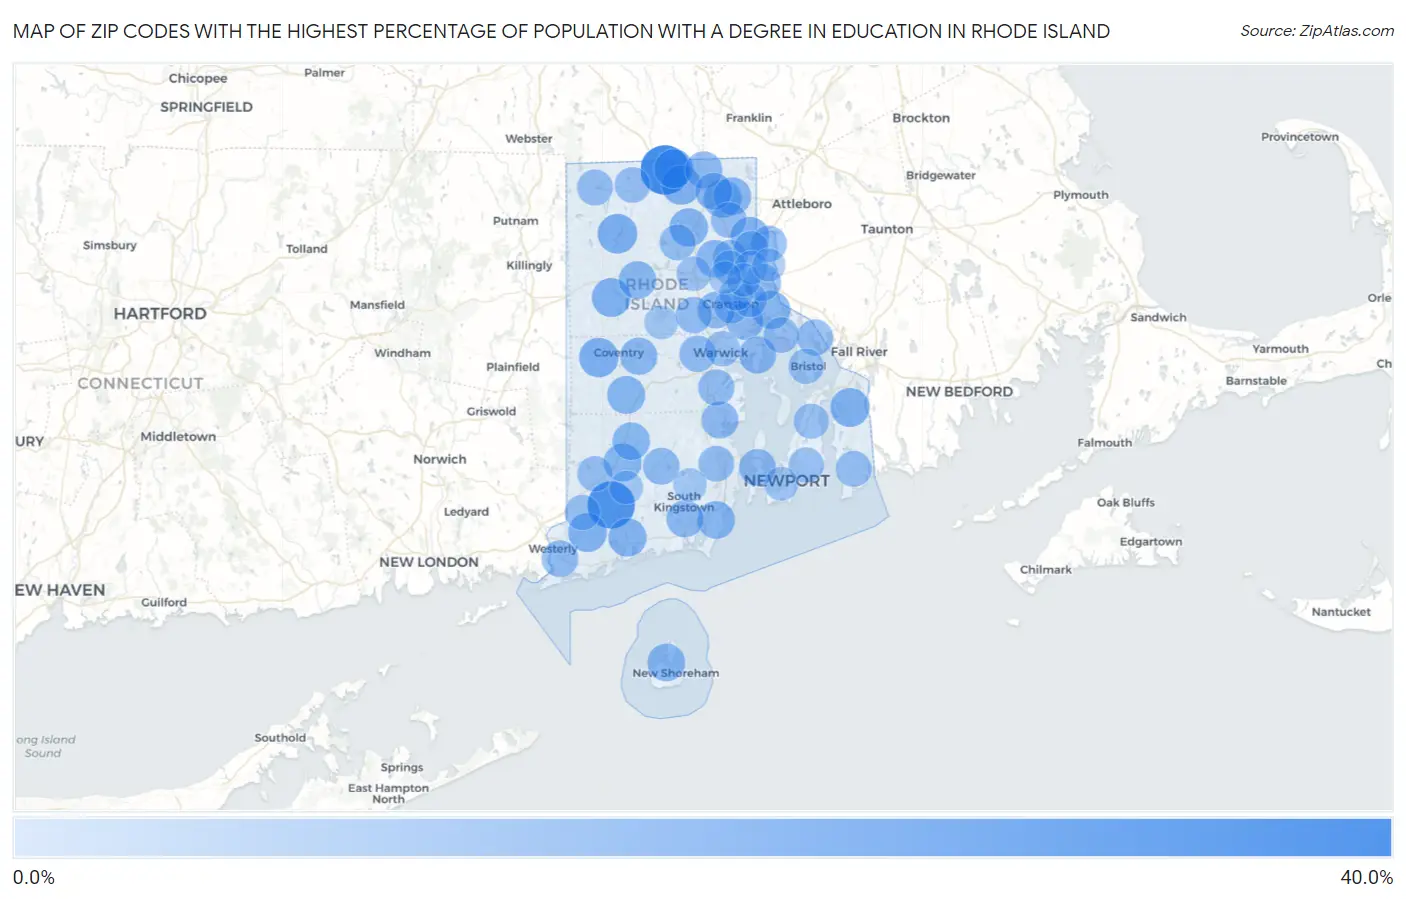
Map of Zip Codes with the Highest Percentage of Population with a Degree in Education in Rhode Island

0.0%
40.0%
Zip Codes with the Highest Percentage of Population with a Degree in Education in Rhode Island Map

Zip Codes with the Highest Percentage of Population with a Degree in Education in Rhode Island

Zip Code % Graduates vs State vs National
1.0287636.9%10.8%(+26.1)#111.1%(+25.8)#2,687
2.0289432.5%10.8%(+21.7)#211.1%(+21.4)#3,677
3.0281417.7%10.8%(+6.98)#311.1%(+6.68)#12,631
4.0282717.2%10.8%(+6.45)#411.1%(+6.16)#13,167
5.0289617.1%10.8%(+6.38)#511.1%(+6.08)#13,259
6.0282416.8%10.8%(+6.05)#611.1%(+5.75)#13,633
7.0287816.6%10.8%(+5.85)#711.1%(+5.55)#13,890
8.0282516.4%10.8%(+5.64)#811.1%(+5.34)#14,102
9.0280816.2%10.8%(+5.41)#911.1%(+5.12)#14,330
10.0286315.7%10.8%(+4.90)#1011.1%(+4.61)#14,897
11.0291715.6%10.8%(+4.85)#1111.1%(+4.55)#14,943
12.0281315.1%10.8%(+4.38)#1211.1%(+4.08)#15,502
13.0291514.9%10.8%(+4.11)#1311.1%(+3.82)#15,866
14.0280214.5%10.8%(+3.75)#1411.1%(+3.45)#16,327
15.0281714.5%10.8%(+3.73)#1511.1%(+3.44)#16,335
16.0289814.4%10.8%(+3.68)#1611.1%(+3.38)#16,395
17.0280714.2%10.8%(+3.42)#1711.1%(+3.12)#16,805
18.0288214.1%10.8%(+3.31)#1811.1%(+3.01)#16,925
19.0282214.0%10.8%(+3.23)#1911.1%(+2.93)#17,036
20.0286413.8%10.8%(+3.06)#2011.1%(+2.76)#17,239
21.0285713.8%10.8%(+3.01)#2111.1%(+2.72)#17,310
22.0291113.7%10.8%(+2.94)#2211.1%(+2.65)#17,403
23.0288813.3%10.8%(+2.53)#2311.1%(+2.24)#17,896
24.0281613.1%10.8%(+2.29)#2411.1%(+1.99)#18,180
25.0288913.0%10.8%(+2.25)#2511.1%(+1.96)#18,224
26.0289513.0%10.8%(+2.25)#2611.1%(+1.95)#18,233
27.0287912.9%10.8%(+2.15)#2711.1%(+1.85)#18,372
28.0283812.8%10.8%(+2.08)#2811.1%(+1.78)#18,464
29.0292012.8%10.8%(+2.04)#2911.1%(+1.75)#18,503
30.0291412.6%10.8%(+1.82)#3011.1%(+1.52)#18,790
31.0285212.6%10.8%(+1.80)#3111.1%(+1.50)#18,818
32.0283512.5%10.8%(+1.70)#3211.1%(+1.41)#18,982
33.0289212.3%10.8%(+1.56)#3311.1%(+1.27)#19,160
34.0289112.0%10.8%(+1.20)#3411.1%(+0.906)#19,670
35.0289311.5%10.8%(+0.764)#3511.1%(+0.466)#20,258
36.0281811.3%10.8%(+0.577)#3611.1%(+0.280)#20,501
37.0292111.3%10.8%(+0.537)#3711.1%(+0.239)#20,554
38.0288511.2%10.8%(+0.422)#3811.1%(+0.125)#20,724
39.0286111.0%10.8%(+0.230)#3911.1%(-0.068)#20,979
40.0282810.9%10.8%(+0.116)#4011.1%(-0.182)#21,129
41.0285910.8%10.8%(+0.058)#4111.1%(-0.239)#21,201
42.0283710.6%10.8%(-0.163)#4211.1%(-0.460)#21,514
43.0287410.5%10.8%(-0.266)#4311.1%(-0.563)#21,660
44.0286510.3%10.8%(-0.491)#4411.1%(-0.788)#21,951
45.0283010.2%10.8%(-0.602)#4511.1%(-0.900)#22,115
46.0280610.0%10.8%(-0.788)#4611.1%(-1.09)#22,404
47.028329.7%10.8%(-1.01)#4711.1%(-1.31)#22,679
48.028099.6%10.8%(-1.13)#4811.1%(-1.43)#22,834
49.028049.5%10.8%(-1.31)#4911.1%(-1.61)#23,066
50.028869.4%10.8%(-1.33)#5011.1%(-1.63)#23,103
51.028429.3%10.8%(-1.43)#5111.1%(-1.73)#23,247
52.028719.3%10.8%(-1.47)#5211.1%(-1.77)#23,307
53.029049.3%10.8%(-1.51)#5311.1%(-1.80)#23,357
54.028609.1%10.8%(-1.69)#5411.1%(-1.99)#23,613
55.029108.2%10.8%(-2.54)#5511.1%(-2.84)#24,620
56.029198.1%10.8%(-2.63)#5611.1%(-2.93)#24,707
57.029057.8%10.8%(-2.98)#5711.1%(-3.28)#25,116
58.029087.0%10.8%(-3.75)#5811.1%(-4.04)#25,916
59.028406.9%10.8%(-3.90)#5911.1%(-4.20)#26,053
60.029076.5%10.8%(-4.23)#6011.1%(-4.53)#26,365
61.029066.5%10.8%(-4.28)#6111.1%(-4.58)#26,410
62.028316.4%10.8%(-4.35)#6211.1%(-4.65)#26,470
63.028126.2%10.8%(-4.53)#6311.1%(-4.82)#26,618
64.028816.1%10.8%(-4.64)#6411.1%(-4.94)#26,730
65.029035.9%10.8%(-4.82)#6511.1%(-5.11)#26,868
66.029165.5%10.8%(-5.30)#6611.1%(-5.60)#27,236
67.029094.2%10.8%(-6.57)#6711.1%(-6.87)#28,073

Common Questions

What are the Top 10 Zip Codes with the Highest Percentage of Population with a Degree in Education in Rhode Island?
Top 10 Zip Codes with the Highest Percentage of Population with a Degree in Education in Rhode Island are:
#1
36.9%
#2
32.5%
#3
17.7%
#4
17.2%
#5
17.1%
#6
16.8%
#7
16.6%
#8
16.4%
#9
16.2%
#10
15.7%
What zip code has the Highest Percentage of Population with a Degree in Education in Rhode Island?
02876 has the Highest Percentage of Population with a Degree in Education in Rhode Island with 36.9%.
What is the Percentage of Population with a Degree in Education in the State of Rhode Island?
Percentage of Population with a Degree in Education in Rhode Island is 10.8%.
What is the Percentage of Population with a Degree in Education in the United States?
Percentage of Population with a Degree in Education in the United States is 11.1%.