Area Code 458 Map & Demographics
Area Code 458 Map
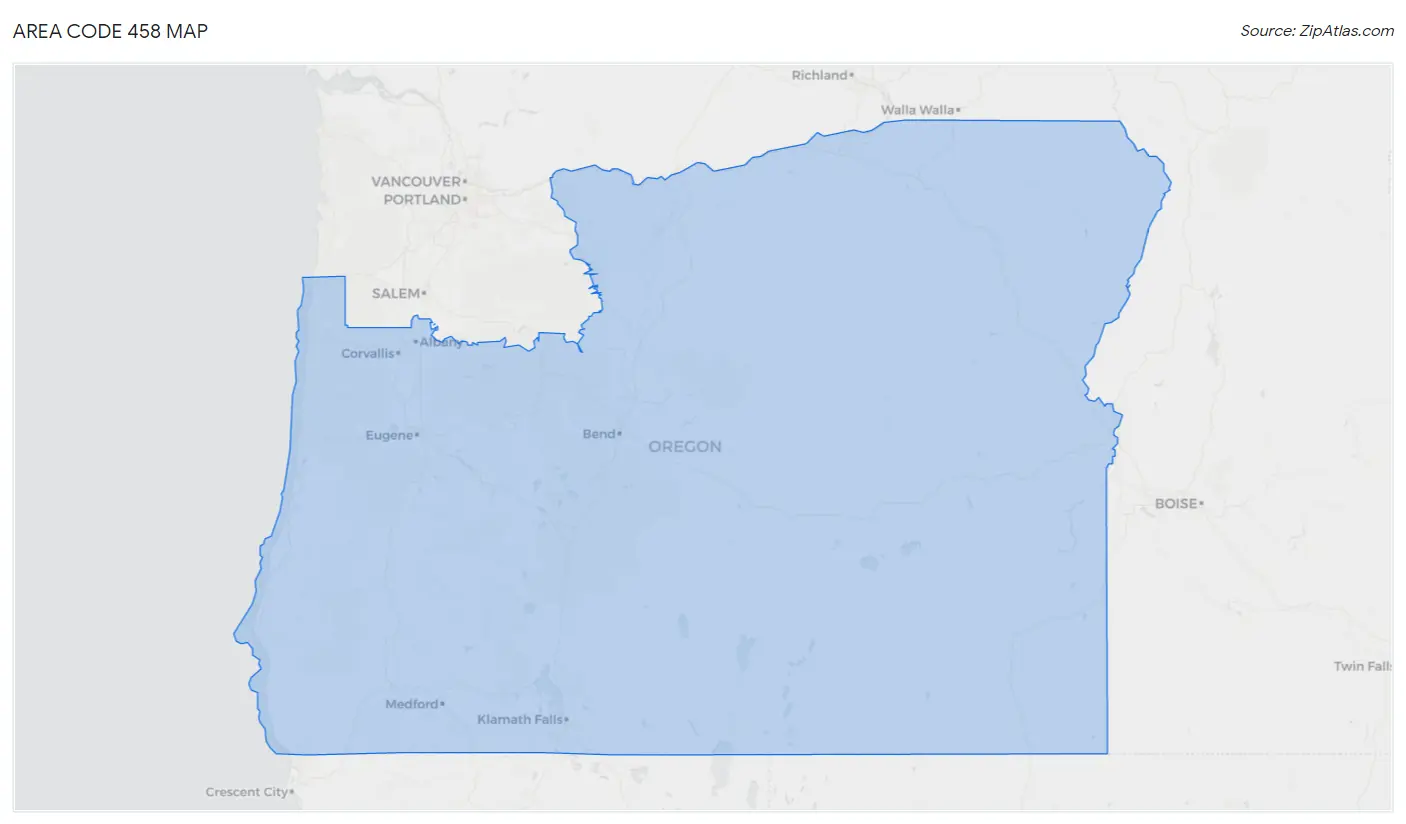
Area Code 458 Overview
$39,182
PER CAPITA INCOME
$91,521
AVG FAMILY INCOME
$63,851
AVG HOUSEHOLD INCOME
30.1%
WAGE / INCOME GAP [ % ]
69.9¢/ $1
WAGE / INCOME GAP [ $ ]
$11,392
FAMILY INCOME DEFICIT
3.22
INEQUALITY / GINI INDEX
210,563
TOTAL POPULATION
103,872
MALE POPULATION
106,691
FEMALE POPULATION
97.36
MALES / 100 FEMALES
102.71
FEMALES / 100 MALES
39.5
MEDIAN AGE
2.8
AVG FAMILY SIZE
2.3
AVG HOUSEHOLD SIZE
109,433
LABOR FORCE [ PEOPLE ]
60.9%
PERCENT IN LABOR FORCE
6.1%
UNEMPLOYMENT RATE
Income in Area Code 458
Income Overview in Area Code 458
Per Capita Income in Area Code 458 is $39,182, while median incomes of families and households are $91,521 and $63,851 respectively.
| Characteristic | Number | Measure |
| Per Capita Income | 210,563 | $39,182 |
| Median Family Income | 46,974 | $91,521 |
| Mean Family Income | 46,974 | $824,788 |
| Median Household Income | 88,833 | $63,851 |
| Mean Household Income | 88,833 | $635,017 |
| Income Deficit | 46,974 | $11,392 |
| Wage / Income Gap (%) | 210,563 | 30.09% |
| Wage / Income Gap ($) | 210,563 | 69.91¢ per $1 |
| Gini / Inequality Index | 210,563 | 3.22 |
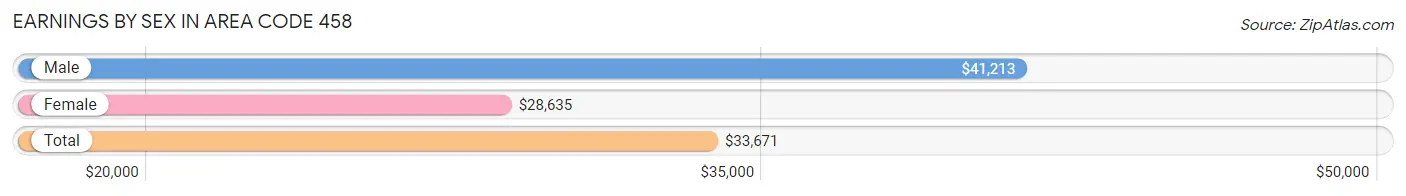
Earnings by Sex in Area Code 458
Average Earnings in Area Code 458 are $33,671, $41,213 for men and $28,635 for women, a difference of 30.5%.
| Sex | Number | Average Earnings |
| Male | 63,354 (51.3%) | $41,213 |
| Female | 60,096 (48.7%) | $28,635 |
| Total | 123,450 (100.0%) | $33,671 |
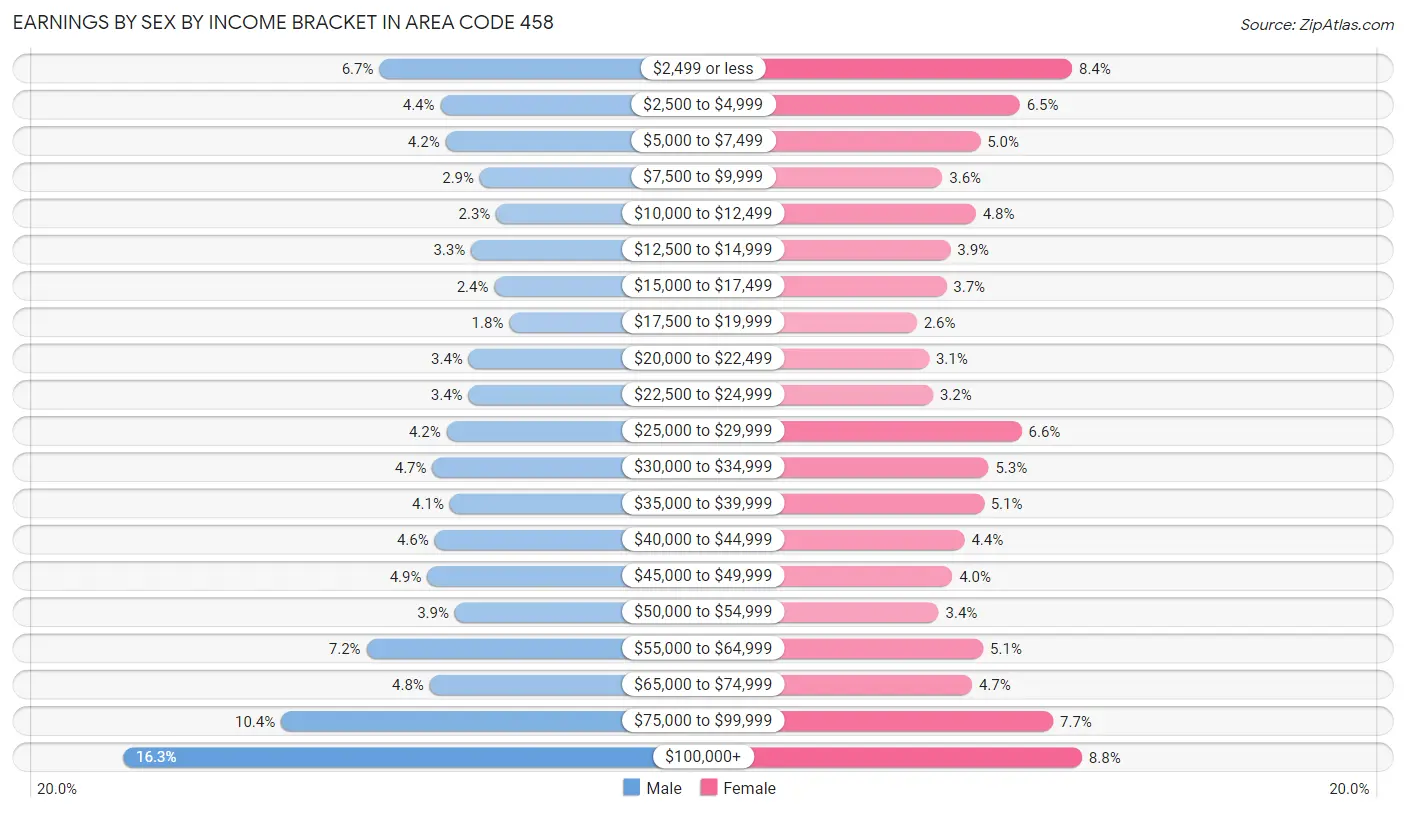
Earnings by Sex by Income Bracket in Area Code 458
The most common earnings brackets in Area Code 458 are $100,000+ for men (10,335 | 16.3%) and $100,000+ for women (5,296 | 8.8%).
| Income | Male | Female |
| $2,499 or less | 4,252 (6.7%) | 5,071 (8.4%) |
| $2,500 to $4,999 | 2,801 (4.4%) | 3,893 (6.5%) |
| $5,000 to $7,499 | 2,680 (4.2%) | 3,002 (5.0%) |
| $7,500 to $9,999 | 1,864 (2.9%) | 2,154 (3.6%) |
| $10,000 to $12,499 | 1,478 (2.3%) | 2,901 (4.8%) |
| $12,500 to $14,999 | 2,070 (3.3%) | 2,332 (3.9%) |
| $15,000 to $17,499 | 1,521 (2.4%) | 2,239 (3.7%) |
| $17,500 to $19,999 | 1,166 (1.8%) | 1,574 (2.6%) |
| $20,000 to $22,499 | 2,130 (3.4%) | 1,852 (3.1%) |
| $22,500 to $24,999 | 2,133 (3.4%) | 1,942 (3.2%) |
| $25,000 to $29,999 | 2,657 (4.2%) | 3,934 (6.6%) |
| $30,000 to $34,999 | 2,992 (4.7%) | 3,193 (5.3%) |
| $35,000 to $39,999 | 2,581 (4.1%) | 3,083 (5.1%) |
| $40,000 to $44,999 | 2,937 (4.6%) | 2,651 (4.4%) |
| $45,000 to $49,999 | 3,111 (4.9%) | 2,373 (4.0%) |
| $50,000 to $54,999 | 2,459 (3.9%) | 2,068 (3.4%) |
| $55,000 to $64,999 | 4,552 (7.2%) | 3,073 (5.1%) |
| $65,000 to $74,999 | 3,053 (4.8%) | 2,821 (4.7%) |
| $75,000 to $99,999 | 6,582 (10.4%) | 4,644 (7.7%) |
| $100,000+ | 10,335 (16.3%) | 5,296 (8.8%) |
| Total | 63,354 (100.0%) | 60,096 (100.0%) |
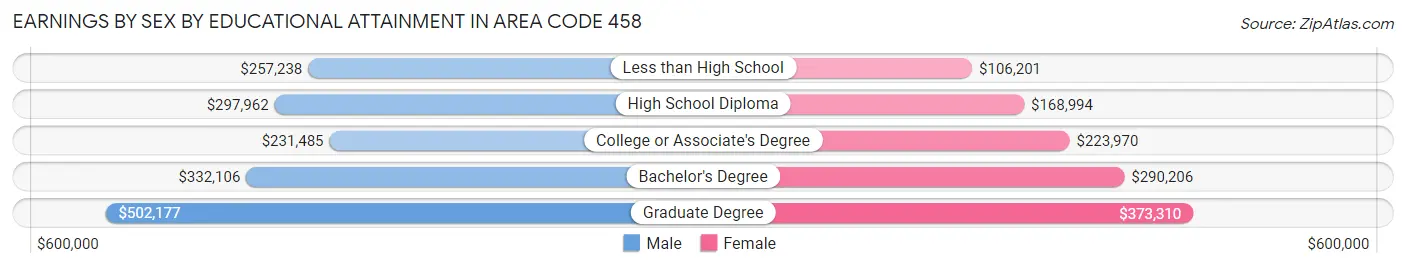
Earnings by Sex by Educational Attainment in Area Code 458
Average earnings in Area Code 458 are $353,855 for men and $269,123 for women, a difference of 23.9%. Men with an educational attainment of graduate degree enjoy the highest average annual earnings of $502,177, while those with college or associate's degree education earn the least with $231,485. Women with an educational attainment of graduate degree earn the most with the average annual earnings of $373,310, while those with less than high school education have the smallest earnings of $106,201.
| Educational Attainment | Male Income | Female Income |
| Less than High School | $257,238 | $106,201 |
| High School Diploma | $297,962 | $168,994 |
| College or Associate's Degree | $231,485 | $223,970 |
| Bachelor's Degree | $332,106 | $290,206 |
| Graduate Degree | $502,177 | $373,310 |
| Total | $353,855 | $269,123 |
Family Income in Area Code 458
Family Income Brackets in Area Code 458
According to the Area Code 458 family income data, there are 69,287 families falling into the $100,000 to $149,999 income range, which is the most common income bracket and makes up 147.5% of all families. Conversely, the $10,000 to $14,999 income bracket is the least frequent group with only 4,650 families (9.9%) belonging to this category.
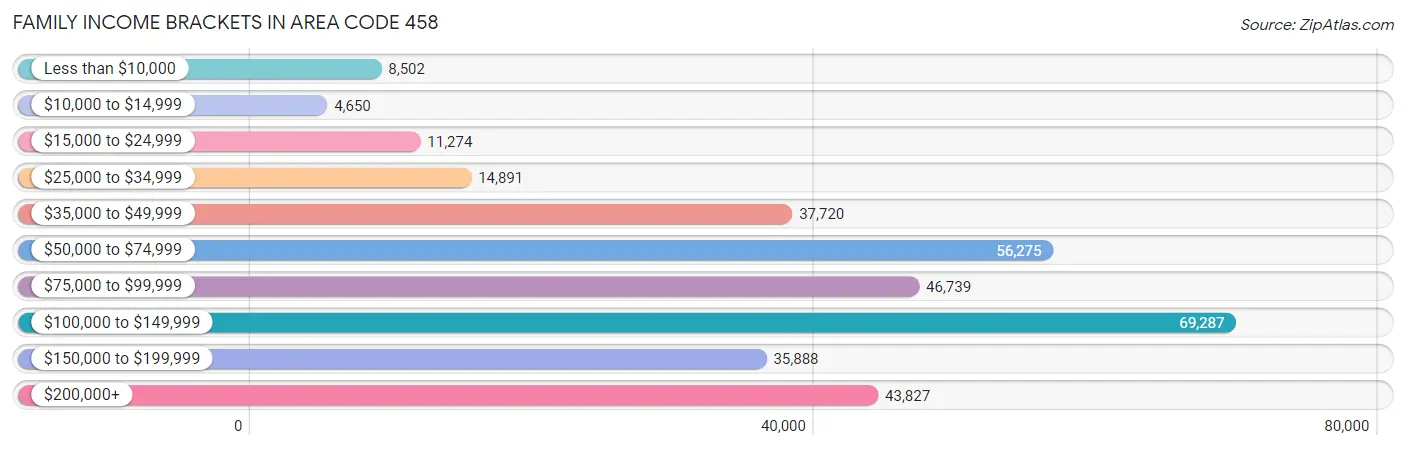
| Income Bracket | # Families | % Families |
| Less than $10,000 | 8,502 | 18.1% |
| $10,000 to $14,999 | 4,650 | 9.9% |
| $15,000 to $24,999 | 11,274 | 24.0% |
| $25,000 to $34,999 | 14,891 | 31.7% |
| $35,000 to $49,999 | 37,720 | 80.3% |
| $50,000 to $74,999 | 56,275 | 119.8% |
| $75,000 to $99,999 | 46,739 | 99.5% |
| $100,000 to $149,999 | 69,287 | 147.5% |
| $150,000 to $199,999 | 35,888 | 76.4% |
| $200,000+ | 43,827 | 93.3% |
Family Income by Famaliy Size in Area Code 458
6-person families (724 | 1.5%) account for the highest median family income in Area Code 458 with $126,102 per family, while 2-person families (25,630 | 54.6%) have the highest median income of $41,107 per family member.
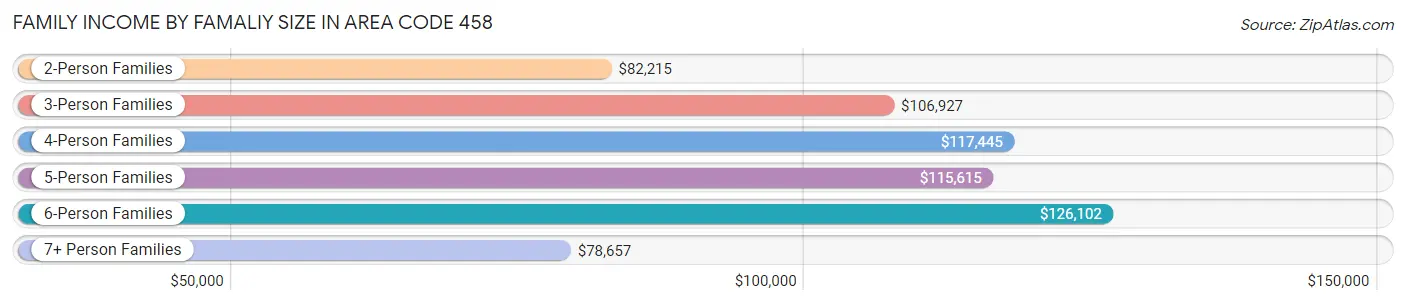
| Income Bracket | # Families | Median Income |
| 2-Person Families | 25,630 (54.6%) | $82,215 |
| 3-Person Families | 9,849 (21.0%) | $106,927 |
| 4-Person Families | 8,219 (17.5%) | $117,445 |
| 5-Person Families | 2,133 (4.5%) | $115,615 |
| 6-Person Families | 724 (1.5%) | $126,102 |
| 7+ Person Families | 419 (0.9%) | $78,657 |
| Total | 46,974 (100.0%) | $91,521 |
Family Income by Number of Earners in Area Code 458
The median family income in Area Code 458 is $91,521, with families comprising 3+ earners (4,428) having the highest median family income of $136,114, while families with 1 earner (14,490) have the lowest median family income of $69,191, accounting for 9.4% and 30.8% of families, respectively.
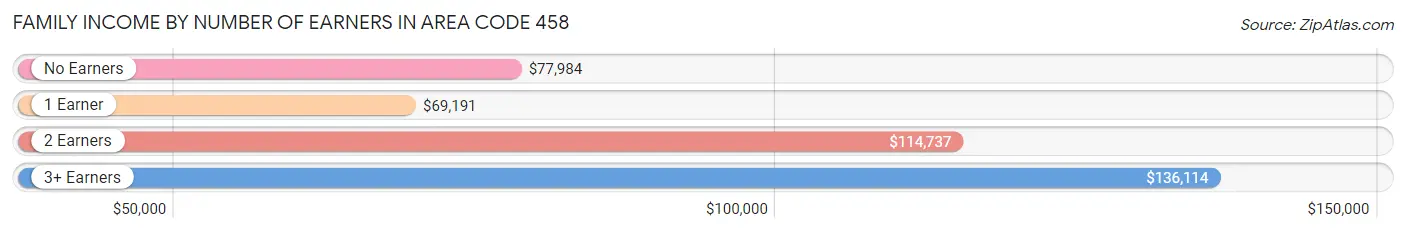
| Number of Earners | # Families | Median Income |
| No Earners | 8,572 (18.2%) | $77,984 |
| 1 Earner | 14,490 (30.8%) | $69,191 |
| 2 Earners | 19,484 (41.5%) | $114,737 |
| 3+ Earners | 4,428 (9.4%) | $136,114 |
| Total | 46,974 (100.0%) | $91,521 |
Household Income in Area Code 458
Household Income Brackets in Area Code 458
With 108,732 households falling in the category, the $50,000 to $74,999 income range is the most frequent in Area Code 458, accounting for 122.4% of all households. In contrast, only 23,541 households (26.5%) fall into the $10,000 to $14,999 income bracket, making it the least populous group.
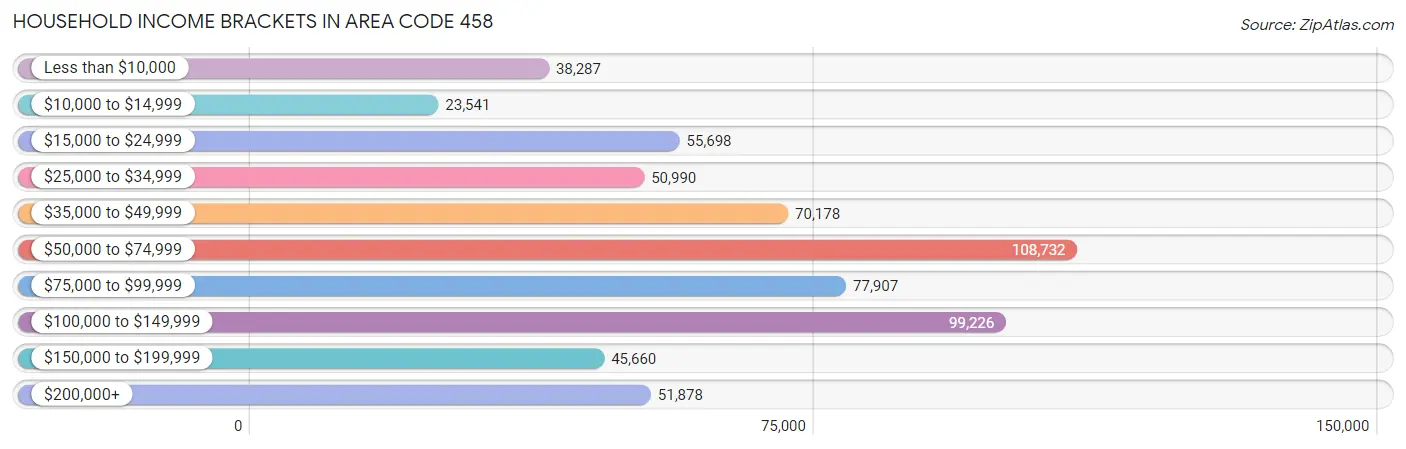
| Income Bracket | # Households | % Households |
| Less than $10,000 | 38,287 | 43.1% |
| $10,000 to $14,999 | 23,541 | 26.5% |
| $15,000 to $24,999 | 55,698 | 62.7% |
| $25,000 to $34,999 | 50,990 | 57.4% |
| $35,000 to $49,999 | 70,178 | 79.0% |
| $50,000 to $74,999 | 108,732 | 122.4% |
| $75,000 to $99,999 | 77,907 | 87.7% |
| $100,000 to $149,999 | 99,226 | 111.7% |
| $150,000 to $199,999 | 45,660 | 51.4% |
| $200,000+ | 51,878 | 58.4% |
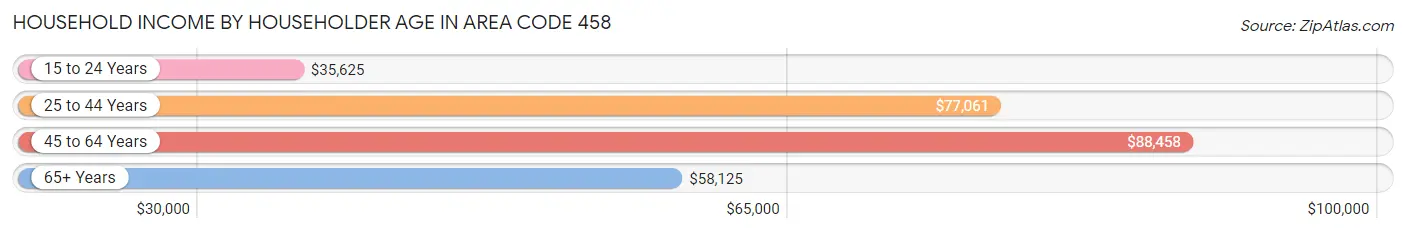
Household Income by Householder Age in Area Code 458
The median household income in Area Code 458 is $63,851, with the highest median household income of $88,458 found in the 45 to 64 years age bracket for the primary householder. A total of 25,990 households (29.3%) fall into this category. Meanwhile, the 15 to 24 years age bracket for the primary householder has the lowest median household income of $35,625, with 9,431 households (10.6%) in this group.
| Income Bracket | # Households | Median Income |
| 15 to 24 Years | 9,431 (10.6%) | $35,625 |
| 25 to 44 Years | 27,941 (31.5%) | $77,061 |
| 45 to 64 Years | 25,990 (29.3%) | $88,458 |
| 65+ Years | 25,471 (28.7%) | $58,125 |
| Total | 88,833 (100.0%) | $63,851 |
Poverty in Area Code 458
Income Below Poverty by Sex and Age in Area Code 458
With 14.5% poverty level for males and 17.6% for females among the residents of Area Code 458, 18 to 24 year old males and 18 to 24 year old females are the most vulnerable to poverty, with 6,210 males (46.2%) and 7,910 females (50.0%) in their respective age groups living below the poverty level.
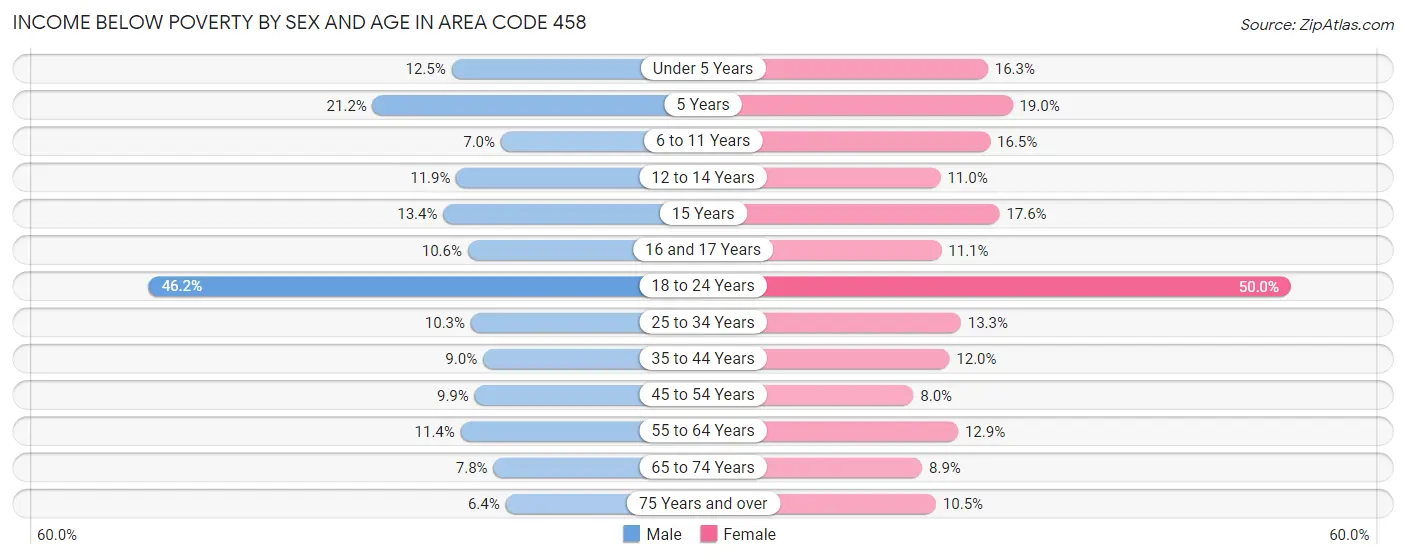
| Age Bracket | Male | Female |
| Under 5 Years | 515 (12.4%) | 670 (16.3%) |
| 5 Years | 202 (21.2%) | 199 (19.0%) |
| 6 to 11 Years | 420 (7.0%) | 917 (16.5%) |
| 12 to 14 Years | 334 (11.9%) | 353 (11.0%) |
| 15 Years | 182 (13.4%) | 199 (17.6%) |
| 16 and 17 Years | 229 (10.6%) | 231 (11.1%) |
| 18 to 24 Years | 6,210 (46.2%) | 7,910 (50.0%) |
| 25 to 34 Years | 1,548 (10.3%) | 1,776 (13.3%) |
| 35 to 44 Years | 1,201 (8.9%) | 1,562 (12.0%) |
| 45 to 54 Years | 1,225 (9.9%) | 874 (8.0%) |
| 55 to 64 Years | 1,254 (11.4%) | 1,545 (12.9%) |
| 65 to 74 Years | 888 (7.8%) | 1,084 (8.9%) |
| 75 Years and over | 434 (6.4%) | 946 (10.5%) |
| Total | 14,642 (14.5%) | 18,266 (17.6%) |
Income Above Poverty by Sex and Age in Area Code 458
According to the poverty statistics in Area Code 458, males aged 75 years and over and females aged 45 to 54 years are the age groups that are most secure financially, with 93.6% of males and 92.0% of females in these age groups living above the poverty line.
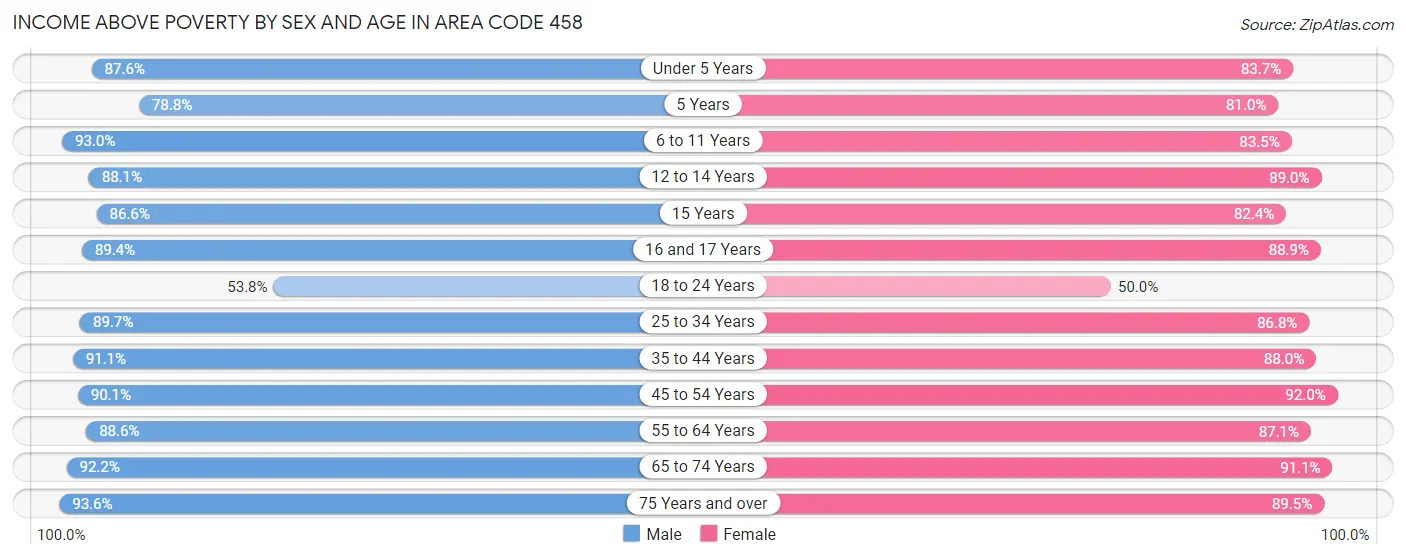
| Age Bracket | Male | Female |
| Under 5 Years | 3,622 (87.5%) | 3,450 (83.7%) |
| 5 Years | 749 (78.8%) | 848 (81.0%) |
| 6 to 11 Years | 5,611 (93.0%) | 4,635 (83.5%) |
| 12 to 14 Years | 2,469 (88.1%) | 2,859 (89.0%) |
| 15 Years | 1,179 (86.6%) | 934 (82.4%) |
| 16 and 17 Years | 1,923 (89.4%) | 1,852 (88.9%) |
| 18 to 24 Years | 7,239 (53.8%) | 7,906 (50.0%) |
| 25 to 34 Years | 13,475 (89.7%) | 11,630 (86.8%) |
| 35 to 44 Years | 12,217 (91.0%) | 11,474 (88.0%) |
| 45 to 54 Years | 11,172 (90.1%) | 10,099 (92.0%) |
| 55 to 64 Years | 9,707 (88.6%) | 10,393 (87.1%) |
| 65 to 74 Years | 10,506 (92.2%) | 11,041 (91.1%) |
| 75 Years and over | 6,301 (93.6%) | 8,080 (89.5%) |
| Total | 86,170 (85.5%) | 85,201 (82.4%) |
Income Below Poverty Among Married-Couple Families in Area Code 458
The poverty statistics for married-couple families in Area Code 458 show that 3.1% or 1,127 of the total 36,446 families live below the poverty line. Families with 5 or more children have the highest poverty rate of 34.4%, comprising of 55 families. On the other hand, families with no children have the lowest poverty rate of 2.4%, which includes 546 families.
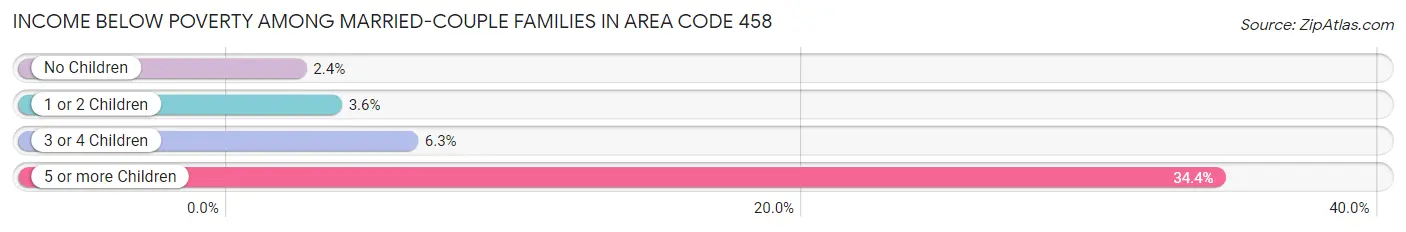
| Children | Above Poverty | Below Poverty |
| No Children | 22,381 (97.6%) | 546 (2.4%) |
| 1 or 2 Children | 11,306 (96.4%) | 424 (3.6%) |
| 3 or 4 Children | 1,527 (93.7%) | 102 (6.3%) |
| 5 or more Children | 105 (65.6%) | 55 (34.4%) |
| Total | 35,319 (96.9%) | 1,127 (3.1%) |
Income Below Poverty Among Single-Parent Households in Area Code 458
According to the poverty data in Area Code 458, 10.6% or 419 single-father households and 24.7% or 1,629 single-mother households are living below the poverty line. Among single-father households, those with 3 or 4 children have the highest poverty rate, with 62 households (20.5%) experiencing poverty. Likewise, among single-mother households, those with 3 or 4 children have the highest poverty rate, with 226 households (67.1%) falling below the poverty line.
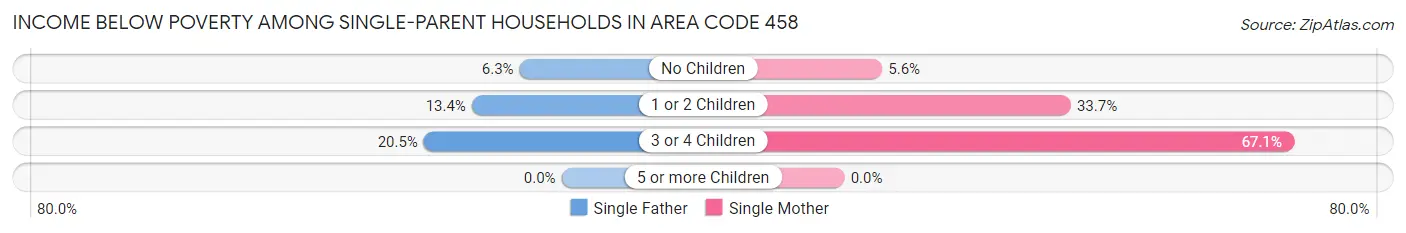
| Children | Single Father | Single Mother |
| No Children | 95 (6.3%) | 140 (5.6%) |
| 1 or 2 Children | 262 (13.4%) | 1,263 (33.7%) |
| 3 or 4 Children | 62 (20.5%) | 226 (67.1%) |
| 5 or more Children | 0 (0.0%) | 0 (0.0%) |
| Total | 419 (10.6%) | 1,629 (24.7%) |
Income Below Poverty Among Married-Couple vs Single-Parent Households in Area Code 458
The poverty data for Area Code 458 shows that 1,127 of the married-couple family households (3.1%) and 2,048 of the single-parent households (19.5%) are living below the poverty level. Within the married-couple family households, those with 5 or more children have the highest poverty rate, with 55 households (34.4%) falling below the poverty line. Among the single-parent households, those with 3 or 4 children have the highest poverty rate, with 288 household (45.1%) living below poverty.
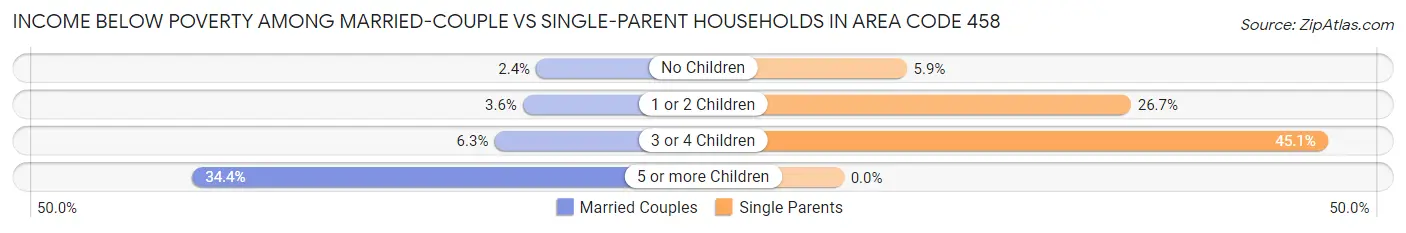
| Children | Married-Couple Families | Single-Parent Households |
| No Children | 546 (2.4%) | 235 (5.9%) |
| 1 or 2 Children | 424 (3.6%) | 1,525 (26.7%) |
| 3 or 4 Children | 102 (6.3%) | 288 (45.1%) |
| 5 or more Children | 55 (34.4%) | 0 (0.0%) |
| Total | 1,127 (3.1%) | 2,048 (19.5%) |
Race in Area Code 458
The most populous races in Area Code 458 are White / Caucasian (179,295 | 85.2%), Hispanic or Latino (18,250 | 8.7%), and Two or more Races (15,795 | 7.5%).
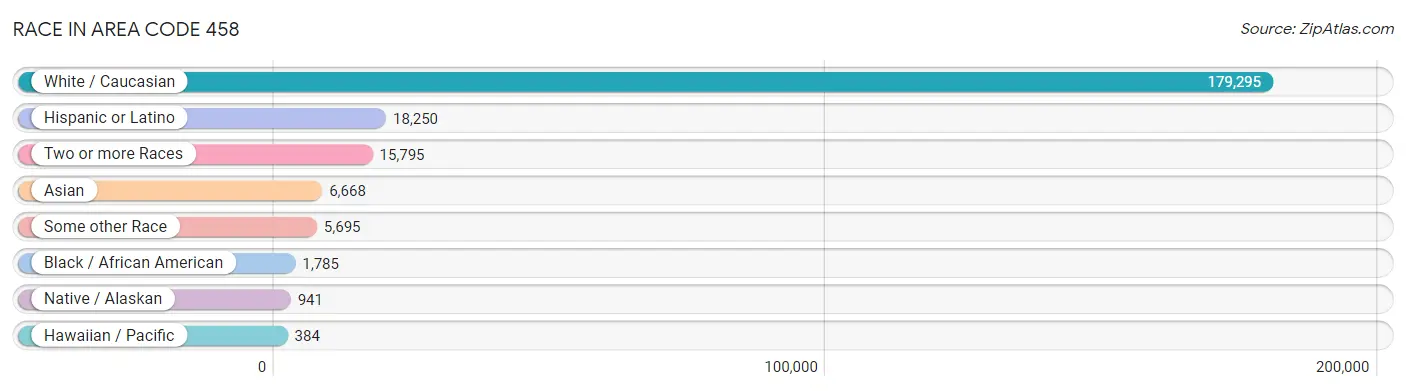
| Race | # Population | % Population |
| Asian | 6,668 | 3.2% |
| Black / African American | 1,785 | 0.9% |
| Hawaiian / Pacific | 384 | 0.2% |
| Hispanic or Latino | 18,250 | 8.7% |
| Native / Alaskan | 941 | 0.4% |
| White / Caucasian | 179,295 | 85.2% |
| Two or more Races | 15,795 | 7.5% |
| Some other Race | 5,695 | 2.7% |
| Total | 210,563 | 100.0% |
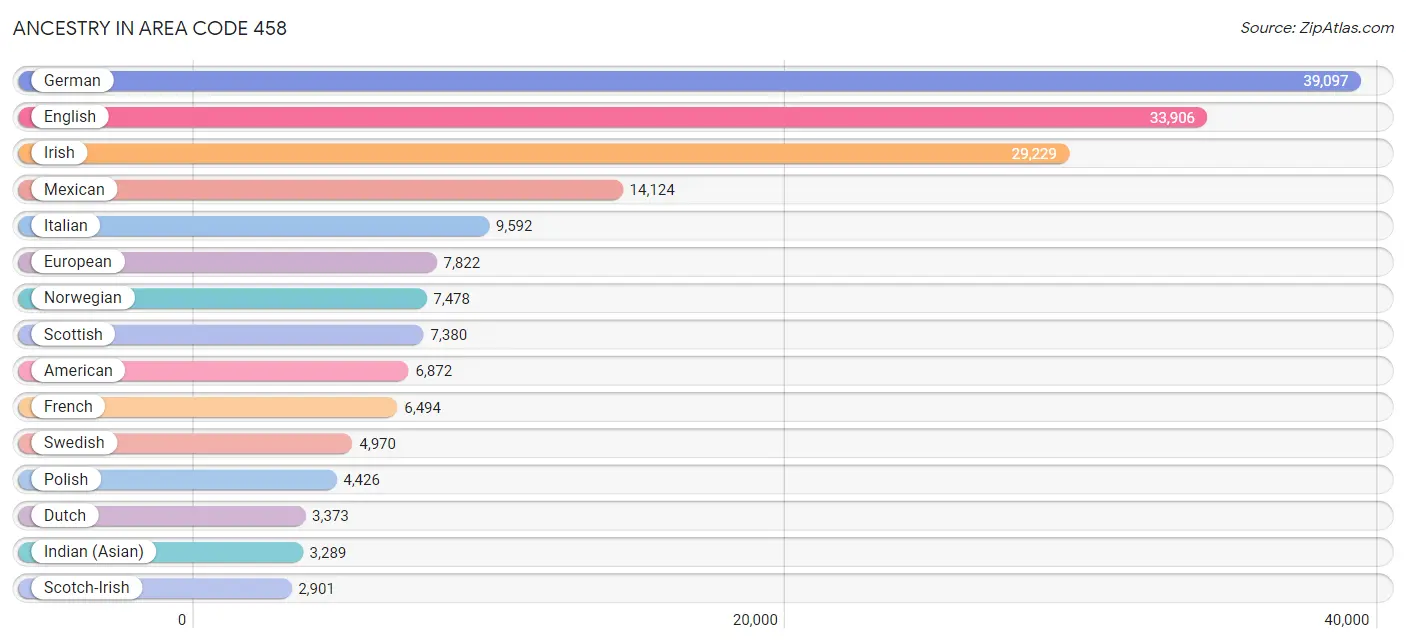
Ancestry in Area Code 458
The most populous ancestries reported in Area Code 458 are German (39,097 | 18.6%), English (33,906 | 16.1%), Irish (29,229 | 13.9%), Mexican (14,124 | 6.7%), and Italian (9,592 | 4.6%), together accounting for 59.8% of all Area Code 458 residents.
| Ancestry | # Population | % Population |
| African | 202 | 0.1% |
| Alaska Native | 10 | 0.0% |
| Alaskan Athabascan | 4 | 0.0% |
| Aleut | 17 | 0.0% |
| Alsatian | 22 | 0.0% |
| American | 6,872 | 3.3% |
| Apache | 31 | 0.0% |
| Arab | 765 | 0.4% |
| Argentinean | 73 | 0.0% |
| Armenian | 440 | 0.2% |
| Australian | 160 | 0.1% |
| Austrian | 752 | 0.4% |
| Bangladeshi | 21 | 0.0% |
| Barbadian | 9 | 0.0% |
| Basque | 251 | 0.1% |
| Belgian | 228 | 0.1% |
| Bhutanese | 2,265 | 1.1% |
| Blackfeet | 201 | 0.1% |
| Bolivian | 13 | 0.0% |
| Brazilian | 242 | 0.1% |
| British | 2,148 | 1.0% |
| Bulgarian | 32 | 0.0% |
| Burmese | 1,350 | 0.6% |
| Cajun | 154 | 0.1% |
| Cambodian | 12 | 0.0% |
| Canadian | 301 | 0.1% |
| Celtic | 52 | 0.0% |
| Central American | 1,179 | 0.6% |
| Central American Indian | 20 | 0.0% |
| Cherokee | 958 | 0.4% |
| Chickasaw | 11 | 0.0% |
| Chilean | 85 | 0.0% |
| Chinese | 60 | 0.0% |
| Chippewa | 85 | 0.0% |
| Choctaw | 177 | 0.1% |
| Colombian | 412 | 0.2% |
| Comanche | 34 | 0.0% |
| Costa Rican | 245 | 0.1% |
| Creek | 29 | 0.0% |
| Croatian | 298 | 0.1% |
| Cuban | 177 | 0.1% |
| Czech | 1,363 | 0.6% |
| Czechoslovakian | 154 | 0.1% |
| Danish | 2,065 | 1.0% |
| Delaware | 28 | 0.0% |
| Dominican | 41 | 0.0% |
| Dutch | 3,373 | 1.6% |
| Eastern European | 1,235 | 0.6% |
| Ecuadorian | 111 | 0.1% |
| Egyptian | 70 | 0.0% |
| English | 33,906 | 16.1% |
| Estonian | 94 | 0.0% |
| Ethiopian | 22 | 0.0% |
| European | 7,822 | 3.7% |
| Fijian | 58 | 0.0% |
| Filipino | 26 | 0.0% |
| Finnish | 1,163 | 0.5% |
| French | 6,494 | 3.1% |
| French American Indian | 8 | 0.0% |
| French Canadian | 1,448 | 0.7% |
| German | 39,097 | 18.6% |
| German Russian | 23 | 0.0% |
| Ghanaian | 118 | 0.1% |
| Greek | 637 | 0.3% |
| Guamanian / Chamorro | 37 | 0.0% |
| Guatemalan | 188 | 0.1% |
| Haitian | 7 | 0.0% |
| Honduran | 35 | 0.0% |
| Hopi | 16 | 0.0% |
| Hungarian | 1,112 | 0.5% |
| Icelander | 248 | 0.1% |
| Indian (Asian) | 3,289 | 1.6% |
| Indonesian | 156 | 0.1% |
| Inupiat | 197 | 0.1% |
| Iranian | 423 | 0.2% |
| Iraqi | 18 | 0.0% |
| Irish | 29,229 | 13.9% |
| Iroquois | 2 | 0.0% |
| Israeli | 231 | 0.1% |
| Italian | 9,592 | 4.6% |
| Japanese | 112 | 0.1% |
| Jordanian | 48 | 0.0% |
| Kenyan | 22 | 0.0% |
| Kiowa | 35 | 0.0% |
| Korean | 1,767 | 0.8% |
| Laotian | 195 | 0.1% |
| Latvian | 153 | 0.1% |
| Lebanese | 283 | 0.1% |
| Lithuanian | 258 | 0.1% |
| Lumbee | 31 | 0.0% |
| Luxembourger | 2 | 0.0% |
| Malaysian | 181 | 0.1% |
| Maltese | 4 | 0.0% |
| Mexican | 14,124 | 6.7% |
| Mexican American Indian | 326 | 0.2% |
| Mongolian | 38 | 0.0% |
| Moroccan | 35 | 0.0% |
| Native Hawaiian | 583 | 0.3% |
| Navajo | 18 | 0.0% |
| Nepalese | 12 | 0.0% |
| New Zealander | 38 | 0.0% |
| Nicaraguan | 312 | 0.2% |
| Nigerian | 176 | 0.1% |
| Northern European | 1,206 | 0.6% |
| Norwegian | 7,478 | 3.5% |
| Osage | 23 | 0.0% |
| Paiute | 10 | 0.0% |
| Pakistani | 175 | 0.1% |
| Palestinian | 83 | 0.0% |
| Panamanian | 36 | 0.0% |
| Pennsylvania German | 44 | 0.0% |
| Peruvian | 163 | 0.1% |
| Polish | 4,426 | 2.1% |
| Portuguese | 1,105 | 0.5% |
| Potawatomi | 62 | 0.0% |
| Pueblo | 1 | 0.0% |
| Puerto Rican | 467 | 0.2% |
| Puget Sound Salish | 15 | 0.0% |
| Romanian | 249 | 0.1% |
| Russian | 2,060 | 1.0% |
| Salvadoran | 363 | 0.2% |
| Samoan | 94 | 0.0% |
| Scandinavian | 1,878 | 0.9% |
| Scotch-Irish | 2,901 | 1.4% |
| Scottish | 7,380 | 3.5% |
| Seminole | 6 | 0.0% |
| Serbian | 298 | 0.1% |
| Shoshone | 72 | 0.0% |
| Sioux | 69 | 0.0% |
| Slavic | 95 | 0.1% |
| Slovak | 202 | 0.1% |
| Slovene | 159 | 0.1% |
| South African | 16 | 0.0% |
| South American | 883 | 0.4% |
| Spaniard | 421 | 0.2% |
| Spanish | 389 | 0.2% |
| Spanish American Indian | 17 | 0.0% |
| Sri Lankan | 668 | 0.3% |
| Subsaharan African | 643 | 0.3% |
| Swedish | 4,970 | 2.4% |
| Swiss | 1,282 | 0.6% |
| Syrian | 30 | 0.0% |
| Thai | 775 | 0.4% |
| Tlingit-Haida | 50 | 0.0% |
| Turkish | 85 | 0.0% |
| Ugandan | 11 | 0.0% |
| Ukrainian | 673 | 0.3% |
| Uruguayan | 8 | 0.0% |
| Ute | 16 | 0.0% |
| Venezuelan | 18 | 0.0% |
| Welsh | 2,338 | 1.1% |
| West Indian | 203 | 0.1% |
| Yaqui | 6 | 0.0% |
| Yugoslavian | 151 | 0.1% | View All 154 Rows |
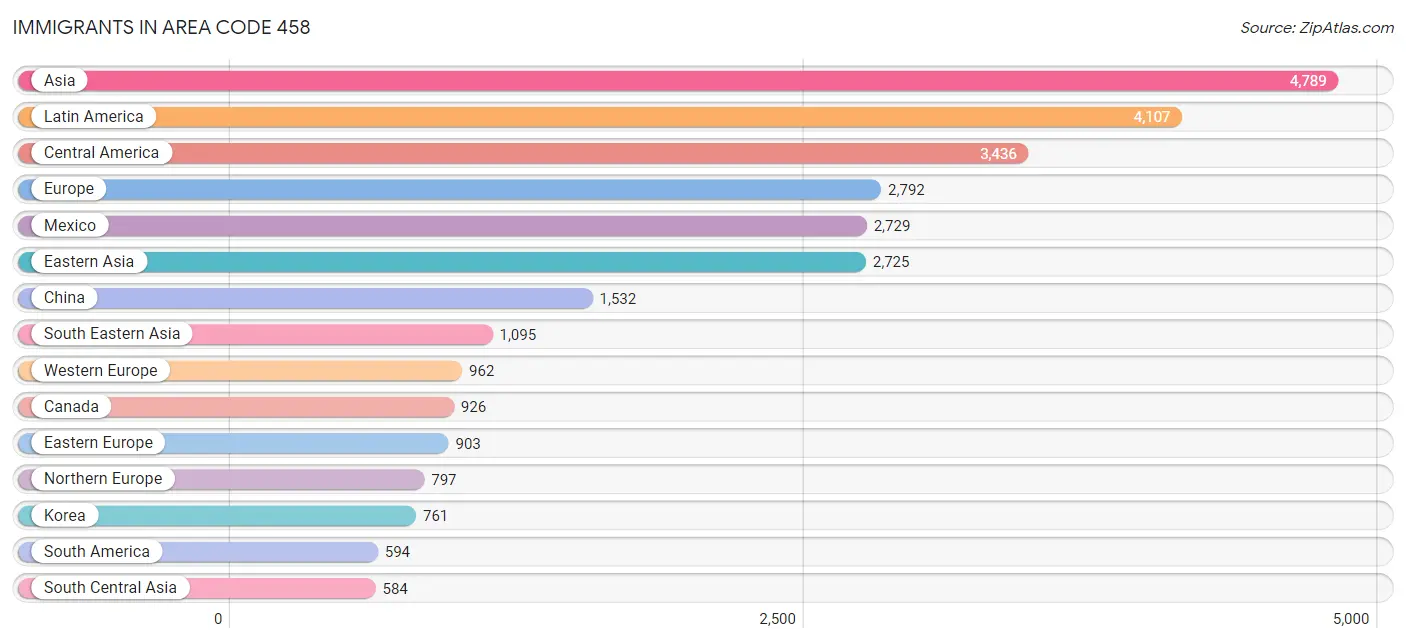
Immigrants in Area Code 458
The most numerous immigrant groups reported in Area Code 458 came from Asia (4,789 | 2.3%), Latin America (4,107 | 1.9%), Central America (3,436 | 1.6%), Europe (2,792 | 1.3%), and Mexico (2,729 | 1.3%), together accounting for 8.5% of all Area Code 458 residents.
| Immigration Origin | # Population | % Population |
| Afghanistan | 7 | 0.0% |
| Africa | 339 | 0.2% |
| Argentina | 79 | 0.0% |
| Asia | 4,789 | 2.3% |
| Australia | 101 | 0.1% |
| Austria | 76 | 0.0% |
| Bangladesh | 29 | 0.0% |
| Bolivia | 13 | 0.0% |
| Brazil | 160 | 0.1% |
| Bulgaria | 86 | 0.0% |
| Cambodia | 148 | 0.1% |
| Canada | 926 | 0.4% |
| Caribbean | 77 | 0.0% |
| Central America | 3,436 | 1.6% |
| China | 1,532 | 0.7% |
| Colombia | 182 | 0.1% |
| Costa Rica | 179 | 0.1% |
| Croatia | 45 | 0.0% |
| Cuba | 64 | 0.0% |
| Czechoslovakia | 71 | 0.0% |
| Denmark | 14 | 0.0% |
| Eastern Africa | 39 | 0.0% |
| Eastern Asia | 2,725 | 1.3% |
| Eastern Europe | 903 | 0.4% |
| Ecuador | 42 | 0.0% |
| El Salvador | 482 | 0.2% |
| England | 376 | 0.2% |
| Europe | 2,792 | 1.3% |
| Fiji | 86 | 0.0% |
| France | 327 | 0.2% |
| Germany | 316 | 0.2% |
| Ghana | 107 | 0.1% |
| Greece | 9 | 0.0% |
| Guatemala | 15 | 0.0% |
| Haiti | 13 | 0.0% |
| Hong Kong | 38 | 0.0% |
| Hungary | 52 | 0.0% |
| India | 288 | 0.1% |
| Indonesia | 101 | 0.1% |
| Iran | 205 | 0.1% |
| Israel | 165 | 0.1% |
| Italy | 53 | 0.0% |
| Japan | 432 | 0.2% |
| Jordan | 16 | 0.0% |
| Kenya | 14 | 0.0% |
| Korea | 761 | 0.4% |
| Kuwait | 21 | 0.0% |
| Laos | 78 | 0.0% |
| Latin America | 4,107 | 1.9% |
| Latvia | 7 | 0.0% |
| Lebanon | 39 | 0.0% |
| Malaysia | 86 | 0.0% |
| Mexico | 2,729 | 1.3% |
| Nepal | 55 | 0.0% |
| Netherlands | 120 | 0.1% |
| Nicaragua | 24 | 0.0% |
| Northern Europe | 797 | 0.4% |
| Norway | 26 | 0.0% |
| Oceania | 242 | 0.1% |
| Panama | 7 | 0.0% |
| Peru | 96 | 0.1% |
| Philippines | 397 | 0.2% |
| Poland | 102 | 0.1% |
| Romania | 104 | 0.1% |
| Russia | 291 | 0.1% |
| Saudi Arabia | 53 | 0.0% |
| Scotland | 27 | 0.0% |
| Serbia | 30 | 0.0% |
| Singapore | 14 | 0.0% |
| South Africa | 186 | 0.1% |
| South America | 594 | 0.3% |
| South Central Asia | 584 | 0.3% |
| South Eastern Asia | 1,095 | 0.5% |
| Southern Europe | 130 | 0.1% |
| Spain | 68 | 0.0% |
| Sweden | 39 | 0.0% |
| Switzerland | 123 | 0.1% |
| Taiwan | 105 | 0.1% |
| Thailand | 79 | 0.0% |
| Turkey | 5 | 0.0% |
| Uganda | 25 | 0.0% |
| Ukraine | 95 | 0.1% |
| Uruguay | 8 | 0.0% |
| Venezuela | 14 | 0.0% |
| Vietnam | 127 | 0.1% |
| Western Africa | 114 | 0.1% |
| Western Asia | 363 | 0.2% |
| Western Europe | 962 | 0.5% | View All 88 Rows |
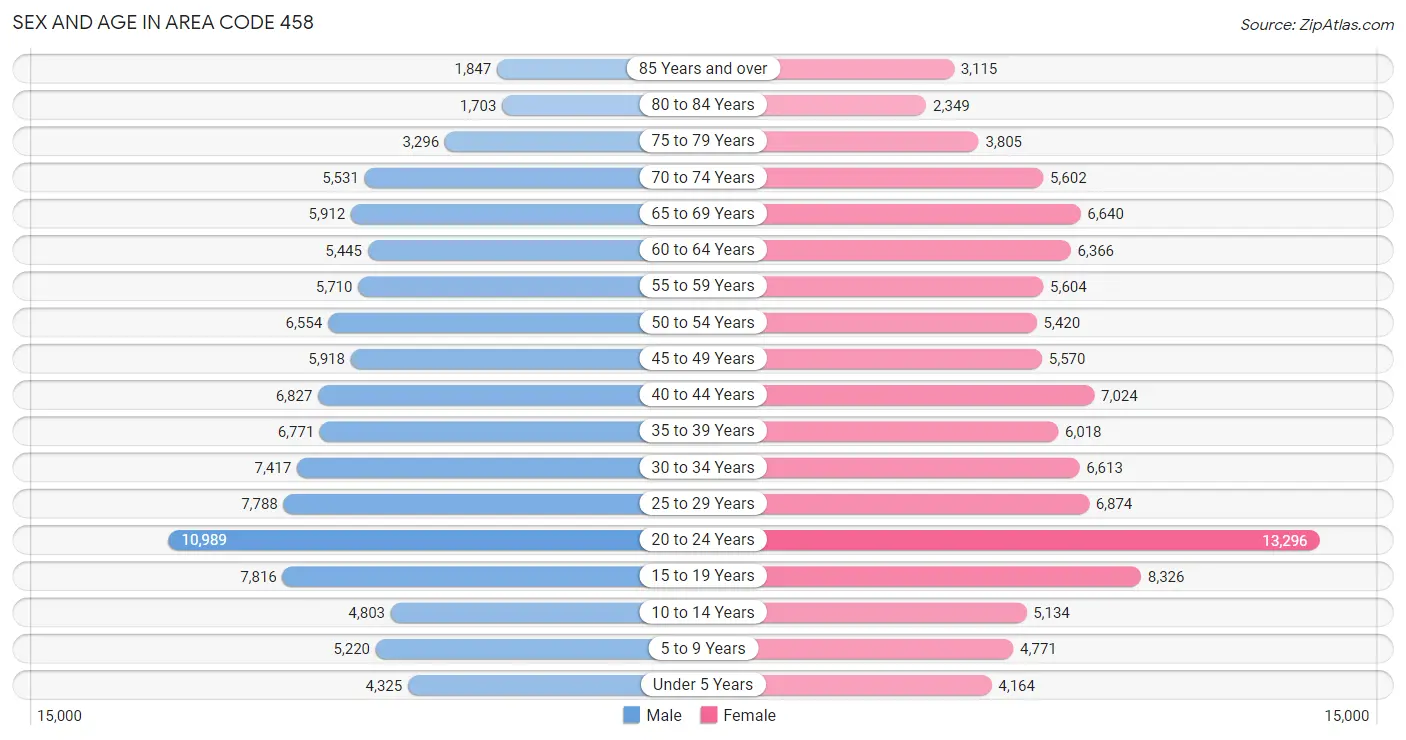
Sex and Age in Area Code 458
Sex and Age in Area Code 458
The most populous age groups in Area Code 458 are 20 to 24 Years (10,989 | 10.6%) for men and 20 to 24 Years (13,296 | 12.5%) for women.
| Age Bracket | Male | Female |
| Under 5 Years | 4,325 (4.2%) | 4,164 (3.9%) |
| 5 to 9 Years | 5,220 (5.0%) | 4,771 (4.5%) |
| 10 to 14 Years | 4,803 (4.6%) | 5,134 (4.8%) |
| 15 to 19 Years | 7,816 (7.5%) | 8,326 (7.8%) |
| 20 to 24 Years | 10,989 (10.6%) | 13,296 (12.5%) |
| 25 to 29 Years | 7,788 (7.5%) | 6,874 (6.4%) |
| 30 to 34 Years | 7,417 (7.1%) | 6,613 (6.2%) |
| 35 to 39 Years | 6,771 (6.5%) | 6,018 (5.6%) |
| 40 to 44 Years | 6,827 (6.6%) | 7,024 (6.6%) |
| 45 to 49 Years | 5,918 (5.7%) | 5,570 (5.2%) |
| 50 to 54 Years | 6,554 (6.3%) | 5,420 (5.1%) |
| 55 to 59 Years | 5,710 (5.5%) | 5,604 (5.2%) |
| 60 to 64 Years | 5,445 (5.2%) | 6,366 (6.0%) |
| 65 to 69 Years | 5,912 (5.7%) | 6,640 (6.2%) |
| 70 to 74 Years | 5,531 (5.3%) | 5,602 (5.2%) |
| 75 to 79 Years | 3,296 (3.2%) | 3,805 (3.6%) |
| 80 to 84 Years | 1,703 (1.6%) | 2,349 (2.2%) |
| 85 Years and over | 1,847 (1.8%) | 3,115 (2.9%) |
| Total | 103,872 (100.0%) | 106,691 (100.0%) |
Families and Households in Area Code 458
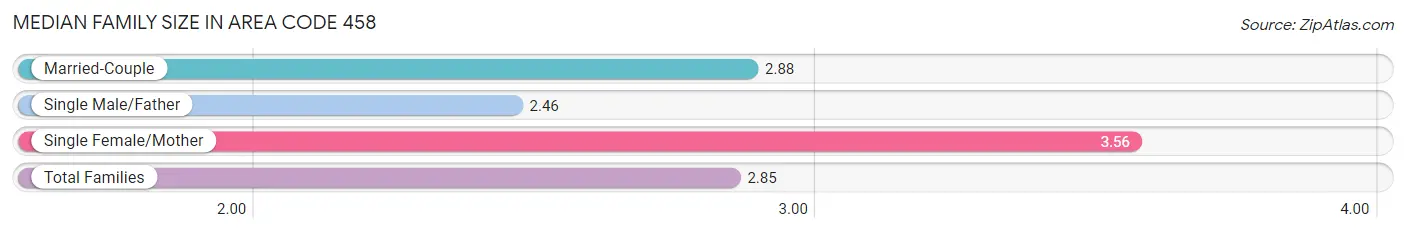
Median Family Size in Area Code 458
The median family size in Area Code 458 is 2.85 persons per family, with single female/mother families (6,581 | 14.0%) accounting for the largest median family size of 3.56285 persons per family. On the other hand, single male/father families (3,947 | 8.4%) represent the smallest median family size with 2.46 persons per family.
| Family Type | # Families | Family Size |
| Married-Couple | 36,446 (77.6%) | 2.88 |
| Single Male/Father | 3,947 (8.4%) | 2.46 |
| Single Female/Mother | 6,581 (14.0%) | 3.56 |
| Total Families | 46,974 (100.0%) | 2.85 |
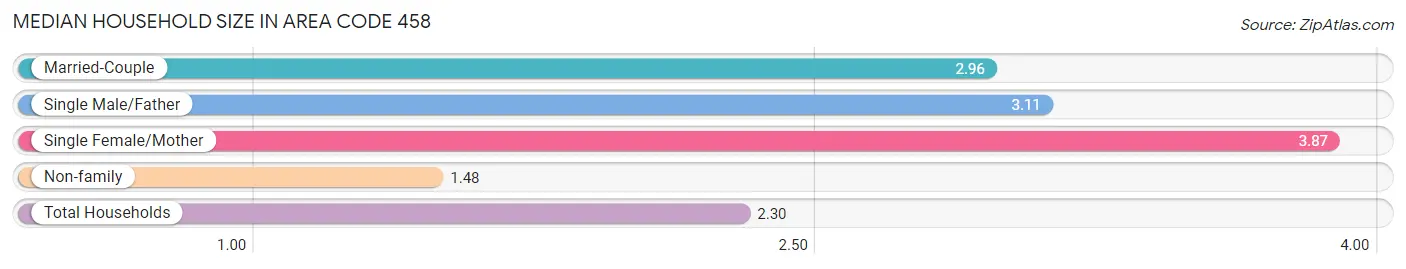
Median Household Size in Area Code 458
The median household size in Area Code 458 is 2.30 persons per household, with single female/mother households (6,581 | 7.4%) accounting for the largest median household size of 3.87428 persons per household. non-family households (41,859 | 47.1%) represent the smallest median household size with 1.48 persons per household.
| Household Type | # Households | Household Size |
| Married-Couple | 36,446 (41.0%) | 2.96 |
| Single Male/Father | 3,947 (4.4%) | 3.11 |
| Single Female/Mother | 6,581 (7.4%) | 3.87 |
| Non-family | 41,859 (47.1%) | 1.48 |
| Total Households | 88,833 (100.0%) | 2.30 |
Household Size by Marriage Status in Area Code 458
Out of a total of 88,833 households in Area Code 458, 46,974 (52.9%) are family households, while 41,859 (47.1%) are nonfamily households. The most numerous type of family households are 2-person households, comprising 23,412, and the most common type of nonfamily households are 1-person households, comprising 28,581.
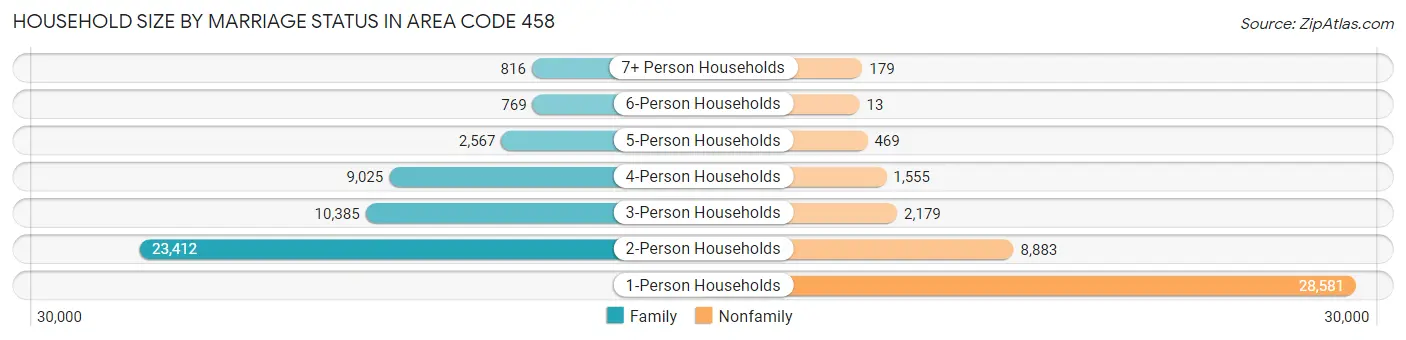
| Household Size | Family Households | Nonfamily Households |
| 1-Person Households | - | 28,581 (32.2%) |
| 2-Person Households | 23,412 (26.4%) | 8,883 (10.0%) |
| 3-Person Households | 10,385 (11.7%) | 2,179 (2.5%) |
| 4-Person Households | 9,025 (10.2%) | 1,555 (1.8%) |
| 5-Person Households | 2,567 (2.9%) | 469 (0.5%) |
| 6-Person Households | 769 (0.9%) | 13 (0.0%) |
| 7+ Person Households | 816 (0.9%) | 179 (0.2%) |
| Total | 46,974 (52.9%) | 41,859 (47.1%) |
Female Fertility in Area Code 458
Fertility by Age in Area Code 458
Average fertility rate in Area Code 458 is 34.7 births per 1,000 women. Women in the age bracket of 35 to 50 years have the highest fertility rate with 50.5 births per 1,000 women. Women in the age bracket of 20 to 34 years acount for 51.4% of all women with births.
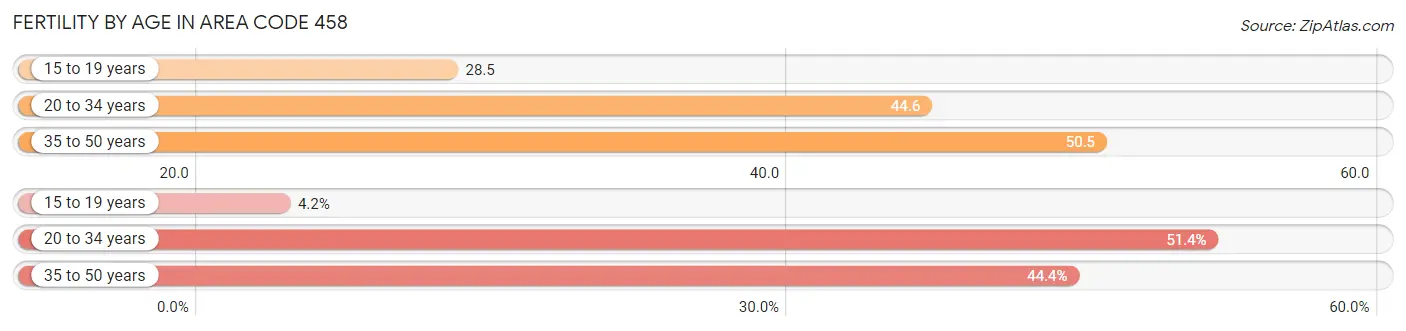
| Age Bracket | Women with Births | Births / 1,000 Women |
| 15 to 19 years | 78 (4.2%) | 28.5 |
| 20 to 34 years | 951 (51.4%) | 44.6 |
| 35 to 50 years | 820 (44.4%) | 50.5 |
| Total | 1,849 (100.0%) | 34.7 |
Fertility by Age by Marriage Status in Area Code 458
73.9% of women with births (1,849) in Area Code 458 are married. The highest percentage of unmarried women with births falls into 20 to 34 years age bracket with 54.0% of them unmarried at the time of birth, while the lowest percentage of unmarried women with births belong to 35 to 50 years age bracket with 9.3% of them unmarried.
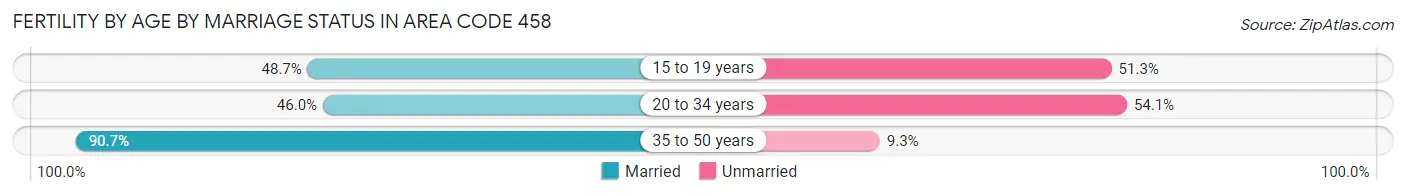
| Age Bracket | Married | Unmarried |
| 15 to 19 years | 38 (48.7%) | 40 (51.3%) |
| 20 to 34 years | 437 (46.0%) | 514 (54.0%) |
| 35 to 50 years | 744 (90.7%) | 76 (9.3%) |
| Total | 1,366 (73.9%) | 483 (26.1%) |
Fertility by Education in Area Code 458
Average fertility rate in Area Code 458 is 34.7 births per 1,000 women. Women with the education attainment of less than high school have the highest fertility rate of 95.5 births per 1,000 women, while women with the education attainment of college or associate's degree have the lowest fertility at 24.3 births per 1,000 women. Women with the education attainment of graduate degree represent 39.1% of all women with births.
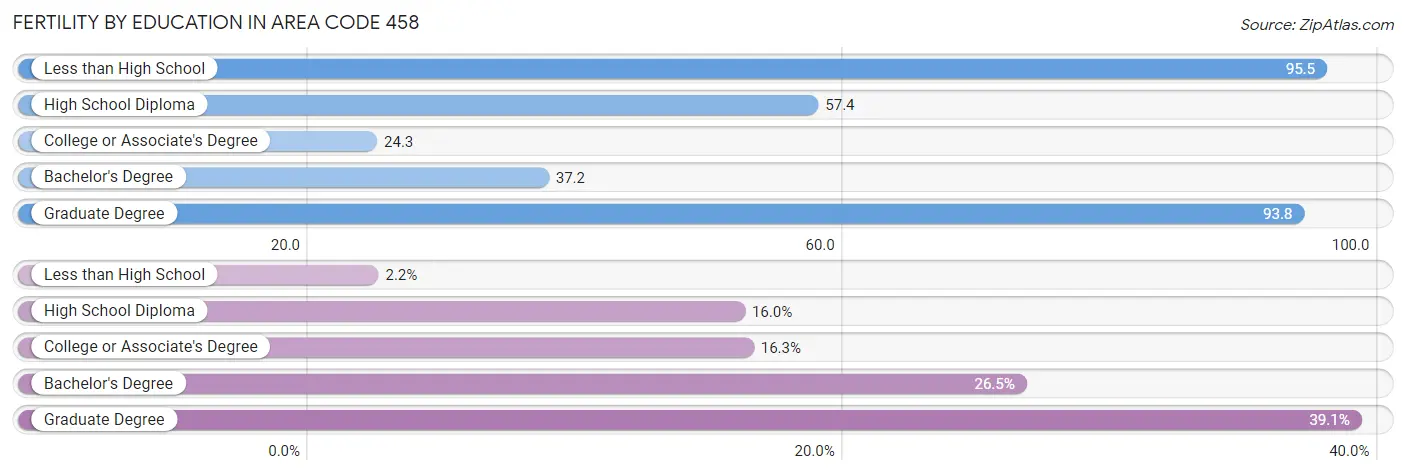
| Educational Attainment | Women with Births | Births / 1,000 Women |
| Less than High School | 41 (2.2%) | 95.5 |
| High School Diploma | 295 (16.0%) | 57.4 |
| College or Associate's Degree | 301 (16.3%) | 24.3 |
| Bachelor's Degree | 490 (26.5%) | 37.2 |
| Graduate Degree | 722 (39.1%) | 93.8 |
| Total | 1,849 (100.0%) | 34.7 |
Fertility by Education by Marriage Status in Area Code 458
26.1% of women with births in Area Code 458 are unmarried. Women with the educational attainment of bachelor's degree are most likely to be married with 100.0% of them married at childbirth, while women with the educational attainment of less than high school are least likely to be married with 100.0% of them unmarried at childbirth.
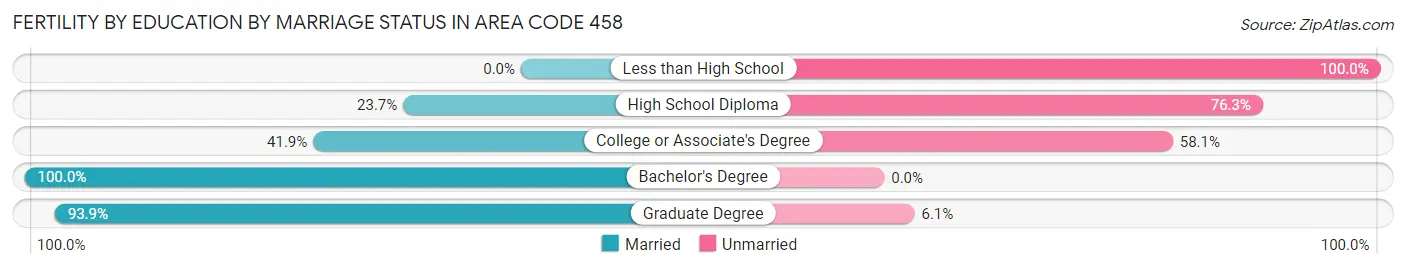
| Educational Attainment | Married | Unmarried |
| Less than High School | 0 (0.0%) | 41 (100.0%) |
| High School Diploma | 70 (23.7%) | 225 (76.3%) |
| College or Associate's Degree | 126 (41.9%) | 175 (58.1%) |
| Bachelor's Degree | 490 (100.0%) | 0 (0.0%) |
| Graduate Degree | 678 (93.9%) | 44 (6.1%) |
| Total | 1,366 (73.9%) | 483 (26.1%) |
Employment Characteristics in Area Code 458
Employment by Class of Employer in Area Code 458
Among the 103,968 employed individuals in Area Code 458, private company employees (62,511 | 60.1%), not-for-profit organizations (9,971 | 9.6%), and self-employed (not incorporated) (8,295 | 8.0%) make up the most common classes of employment.
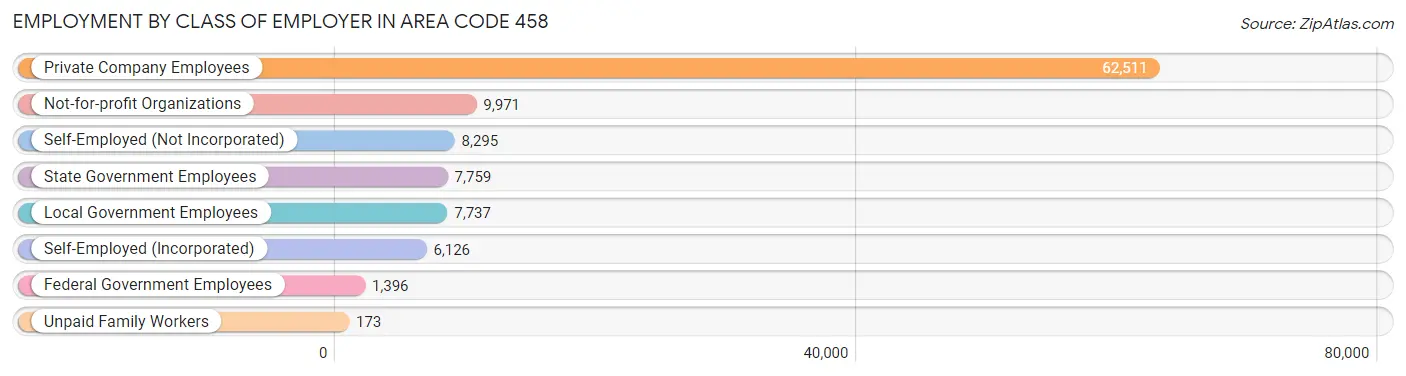
| Employer Class | # Employees | % Employees |
| Private Company Employees | 62,511 | 60.1% |
| Self-Employed (Incorporated) | 6,126 | 5.9% |
| Self-Employed (Not Incorporated) | 8,295 | 8.0% |
| Not-for-profit Organizations | 9,971 | 9.6% |
| Local Government Employees | 7,737 | 7.4% |
| State Government Employees | 7,759 | 7.5% |
| Federal Government Employees | 1,396 | 1.3% |
| Unpaid Family Workers | 173 | 0.2% |
| Total | 103,968 | 100.0% |
Employment Status by Age in Area Code 458
According to the labor force statistics for Area Code 458, out of the total population over 16 years of age (179,651), 60.9% or 109,425 individuals are in the labor force, with 6.1% or 6,686 of them unemployed. The age group with the highest labor force participation rate is 30 to 34 years, with 88.6% or 12,425 individuals in the labor force. Within the labor force, the 75 years and over age range has the highest percentage of unemployed individuals, with 104.7% or 1,237 of them being unemployed.
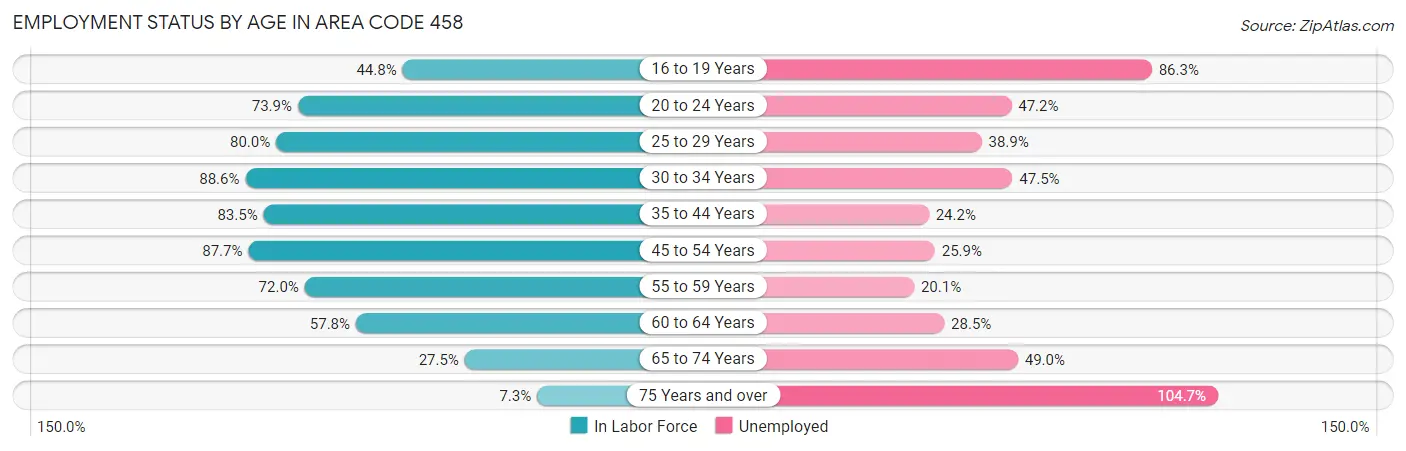
| Age Bracket | In Labor Force | Unemployed |
| 16 to 19 Years | 6,112 (44.8%) | 5,275 (86.3%) |
| 20 to 24 Years | 17,954 (73.9%) | 8,474 (47.2%) |
| 25 to 29 Years | 11,728 (80.0%) | 4,562 (38.9%) |
| 30 to 34 Years | 12,425 (88.6%) | 5,902 (47.5%) |
| 35 to 44 Years | 22,241 (83.5%) | 5,383 (24.2%) |
| 45 to 54 Years | 20,583 (87.7%) | 5,331 (25.9%) |
| 55 to 59 Years | 8,149 (72.0%) | 1,638 (20.1%) |
| 60 to 64 Years | 6,823 (57.8%) | 1,945 (28.5%) |
| 65 to 74 Years | 6,507 (27.5%) | 3,188 (49.0%) |
| 75 Years and over | 1,181 (7.3%) | 1,237 (104.7%) |
| Total | 109,433 (60.9%) | 6,691 (6.1%) |
Employment Status by Educational Attainment in Area Code 458
According to labor force statistics for Area Code 458, 80.0% of individuals (81,525) out of the total population between 25 and 64 years of age (101,919) are in the labor force, with 31.0% or 25,273 of them being unemployed. The group with the highest labor force participation rate are those with the educational attainment of bachelor's degree or higher, with 83.5% or 39,322 individuals in the labor force. Within the labor force, individuals with high school diploma education have the highest percentage of unemployment, with 54.9% or 6,681 of them being unemployed.
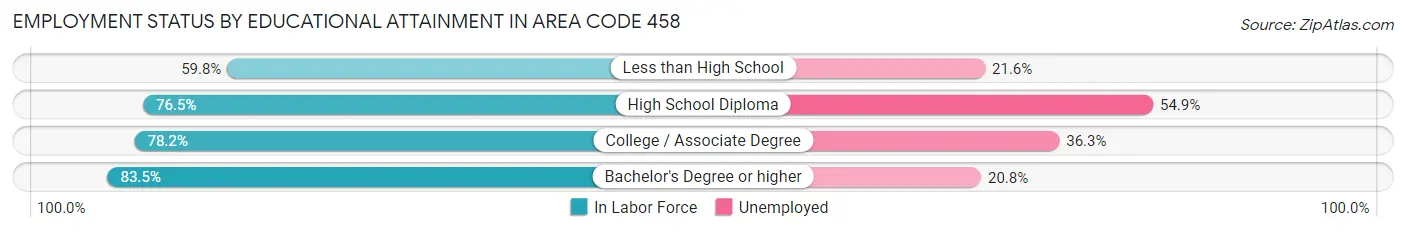
| Educational Attainment | In Labor Force | Unemployed |
| Less than High School | 3,011 (59.8%) | 1,087 (21.6%) |
| High School Diploma | 12,170 (76.5%) | 8,733 (54.9%) |
| College / Associate Degree | 26,516 (78.2%) | 12,309 (36.3%) |
| Bachelor's Degree or higher | 39,324 (83.5%) | 9,791 (20.8%) |
| Total | 81,521 (80.0%) | 31,595 (31.0%) |
Employment Occupations by Sex in Area Code 458
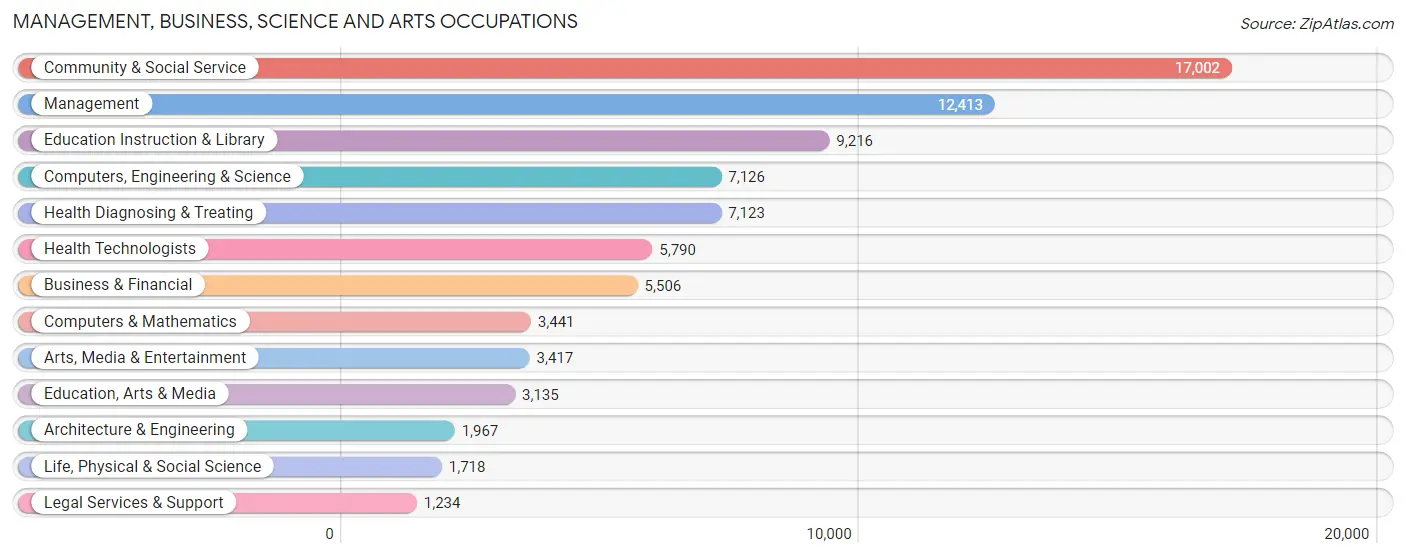
Management, Business, Science and Arts Occupations
The most common Management, Business, Science and Arts occupations in Area Code 458 are Community & Social Service (17,002 | 16.0%), Management (12,413 | 11.7%), Education Instruction & Library (9,216 | 8.7%), Computers, Engineering & Science (7,126 | 6.7%), and Health Diagnosing & Treating (7,123 | 6.7%).
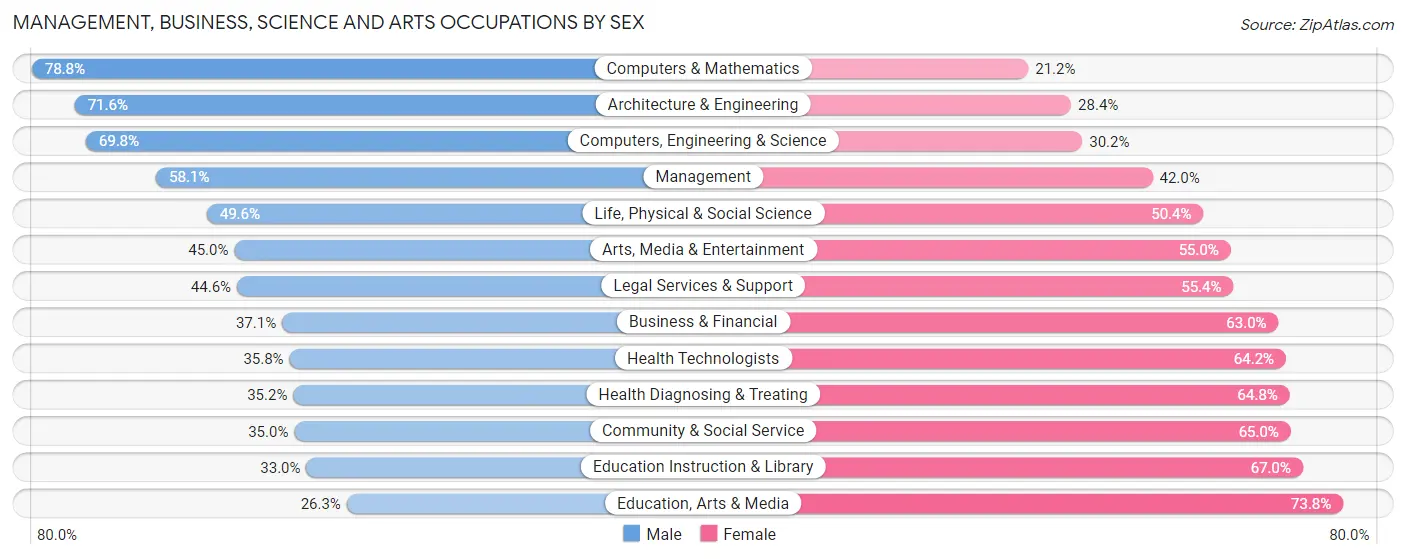
Management, Business, Science and Arts Occupations by Sex
Within the Management, Business, Science and Arts occupations in Area Code 458, the most male-oriented occupations are Computers & Mathematics (78.8%), Architecture & Engineering (71.6%), and Computers, Engineering & Science (69.8%), while the most female-oriented occupations are Education, Arts & Media (73.8%), Education Instruction & Library (67.0%), and Community & Social Service (65.0%).
| Occupation | Male | Female |
| Management | 7,206 (58.1%) | 5,207 (41.9%) |
| Business & Financial | 2,040 (37.0%) | 3,466 (62.9%) |
| Computers, Engineering & Science | 4,972 (69.8%) | 2,154 (30.2%) |
| Computers & Mathematics | 2,711 (78.8%) | 730 (21.2%) |
| Architecture & Engineering | 1,409 (71.6%) | 558 (28.4%) |
| Life, Physical & Social Science | 852 (49.6%) | 866 (50.4%) |
| Community & Social Service | 5,950 (35.0%) | 11,052 (65.0%) |
| Education, Arts & Media | 823 (26.3%) | 2,312 (73.8%) |
| Legal Services & Support | 550 (44.6%) | 684 (55.4%) |
| Education Instruction & Library | 3,039 (33.0%) | 6,177 (67.0%) |
| Arts, Media & Entertainment | 1,538 (45.0%) | 1,879 (55.0%) |
| Health Diagnosing & Treating | 2,505 (35.2%) | 4,618 (64.8%) |
| Health Technologists | 2,073 (35.8%) | 3,717 (64.2%) |
| Total (Category) | 22,673 (46.1%) | 26,497 (53.9%) |
| Total (Overall) | 53,923 (50.9%) | 52,049 (49.1%) |
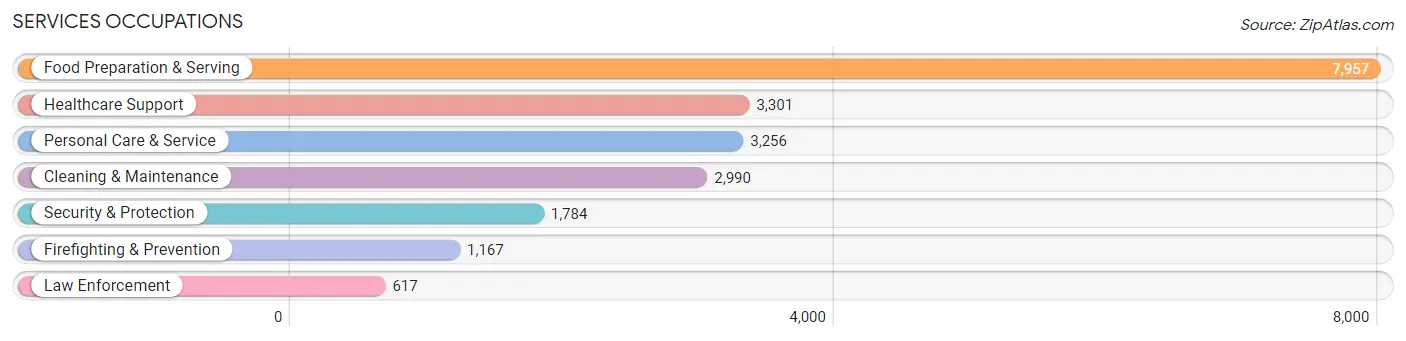
Services Occupations
The most common Services occupations in Area Code 458 are Food Preparation & Serving (7,957 | 7.5%), Healthcare Support (3,301 | 3.1%), Personal Care & Service (3,256 | 3.1%), Cleaning & Maintenance (2,990 | 2.8%), and Security & Protection (1,784 | 1.7%).
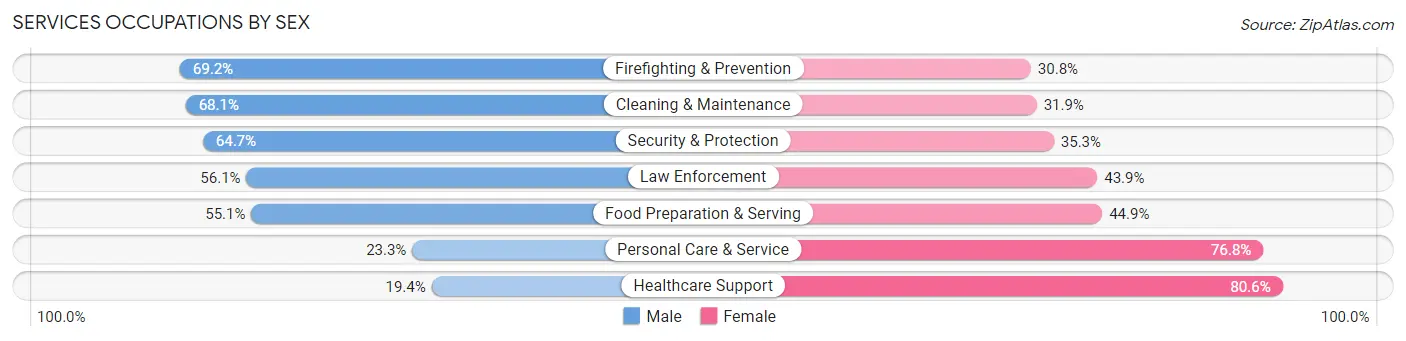
Services Occupations by Sex
Within the Services occupations in Area Code 458, the most male-oriented occupations are Firefighting & Prevention (69.2%), Cleaning & Maintenance (68.1%), and Security & Protection (64.7%), while the most female-oriented occupations are Healthcare Support (80.6%), Personal Care & Service (76.7%), and Food Preparation & Serving (44.9%).
| Occupation | Male | Female |
| Healthcare Support | 641 (19.4%) | 2,660 (80.6%) |
| Security & Protection | 1,154 (64.7%) | 630 (35.3%) |
| Firefighting & Prevention | 808 (69.2%) | 359 (30.8%) |
| Law Enforcement | 346 (56.1%) | 271 (43.9%) |
| Food Preparation & Serving | 4,385 (55.1%) | 3,572 (44.9%) |
| Cleaning & Maintenance | 2,036 (68.1%) | 954 (31.9%) |
| Personal Care & Service | 757 (23.3%) | 2,499 (76.7%) |
| Total (Category) | 8,973 (46.5%) | 10,315 (53.5%) |
| Total (Overall) | 53,923 (50.9%) | 52,049 (49.1%) |
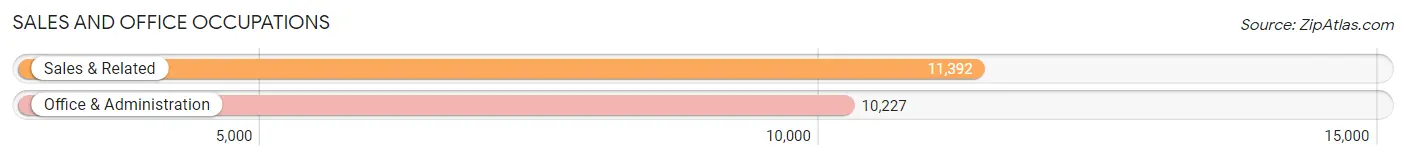
Sales and Office Occupations
The most common Sales and Office occupations in Area Code 458 are Sales & Related (11,392 | 10.7%), and Office & Administration (10,227 | 9.7%).
Sales and Office Occupations by Sex
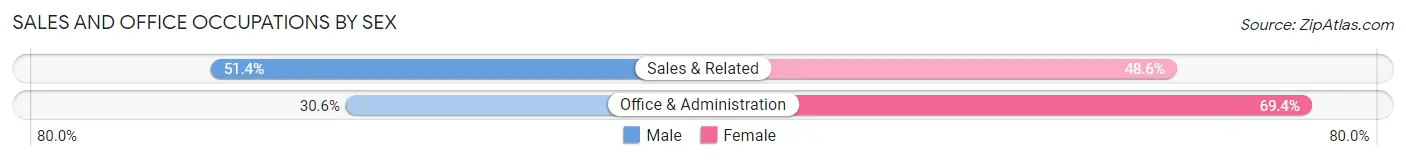
| Occupation | Male | Female |
| Sales & Related | 5,851 (51.4%) | 5,541 (48.6%) |
| Office & Administration | 3,127 (30.6%) | 7,100 (69.4%) |
| Total (Category) | 8,978 (41.5%) | 12,641 (58.5%) |
| Total (Overall) | 53,923 (50.9%) | 52,049 (49.1%) |
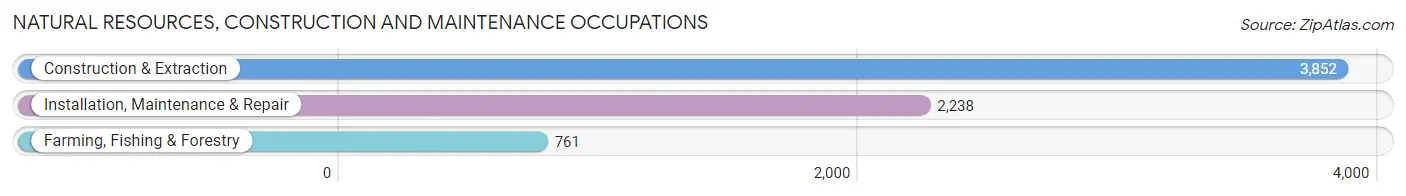
Natural Resources, Construction and Maintenance Occupations
The most common Natural Resources, Construction and Maintenance occupations in Area Code 458 are Construction & Extraction (3,852 | 3.6%), Installation, Maintenance & Repair (2,238 | 2.1%), and Farming, Fishing & Forestry (761 | 0.7%).
Natural Resources, Construction and Maintenance Occupations by Sex
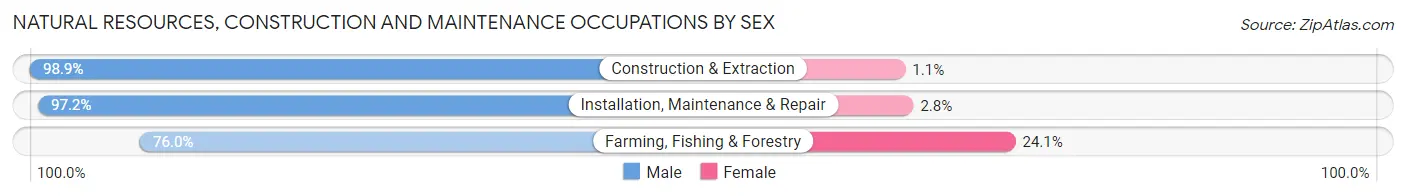
| Occupation | Male | Female |
| Farming, Fishing & Forestry | 578 (75.9%) | 183 (24.0%) |
| Construction & Extraction | 3,808 (98.9%) | 44 (1.1%) |
| Installation, Maintenance & Repair | 2,175 (97.2%) | 63 (2.8%) |
| Total (Category) | 6,561 (95.8%) | 290 (4.2%) |
| Total (Overall) | 53,923 (50.9%) | 52,049 (49.1%) |
Production, Transportation and Moving Occupations
The most common Production, Transportation and Moving occupations in Area Code 458 are Production (4,333 | 4.1%), Transportation (2,482 | 2.3%), and Material Moving (2,229 | 2.1%).
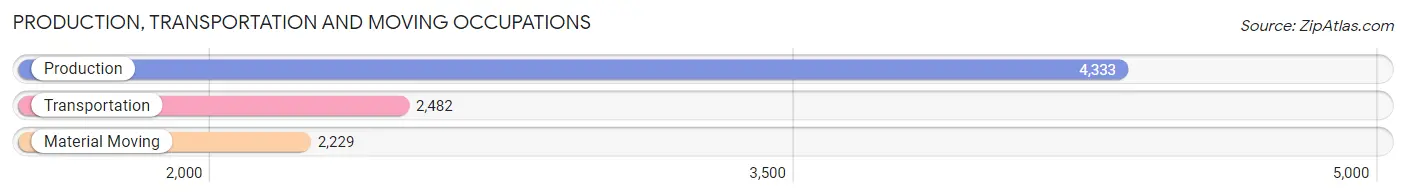
Production, Transportation and Moving Occupations by Sex
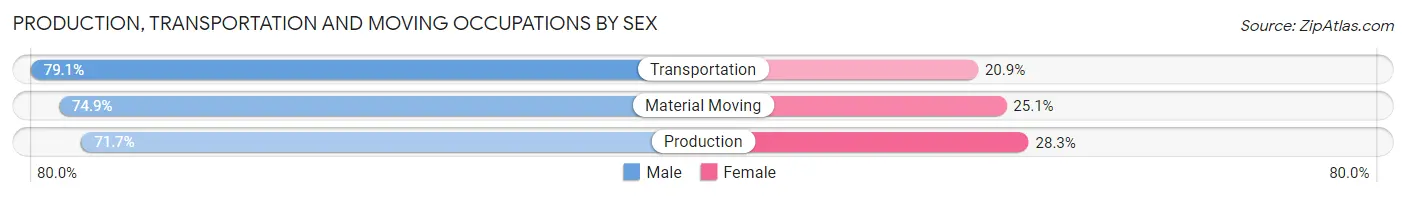
| Occupation | Male | Female |
| Production | 3,105 (71.7%) | 1,228 (28.3%) |
| Transportation | 1,963 (79.1%) | 519 (20.9%) |
| Material Moving | 1,670 (74.9%) | 559 (25.1%) |
| Total (Category) | 6,738 (74.5%) | 2,306 (25.5%) |
| Total (Overall) | 53,923 (50.9%) | 52,049 (49.1%) |
Employment Industries by Sex in Area Code 458
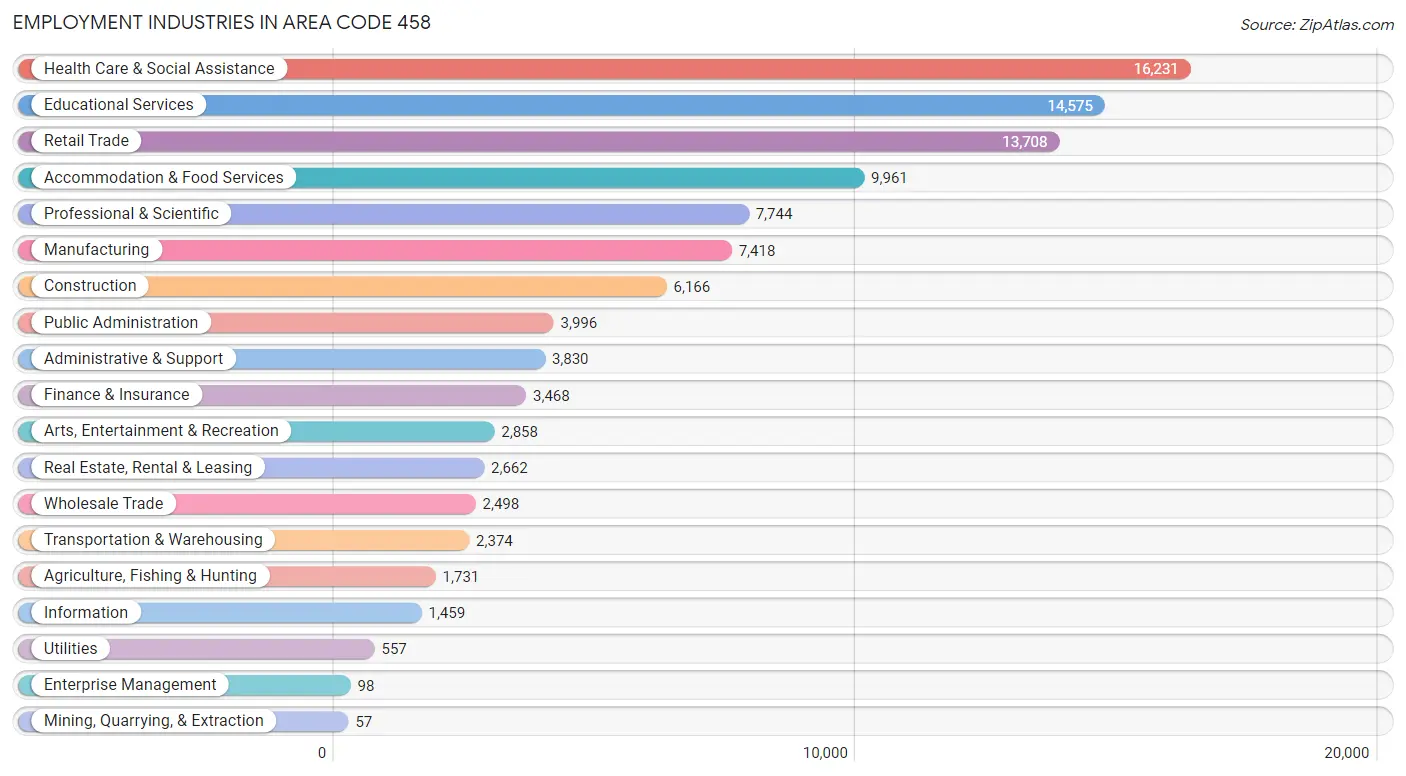
Employment Industries in Area Code 458
The major employment industries in Area Code 458 include Health Care & Social Assistance (16,231 | 15.3%), Educational Services (14,575 | 13.8%), Retail Trade (13,708 | 12.9%), Accommodation & Food Services (9,961 | 9.4%), and Professional & Scientific (7,744 | 7.3%).
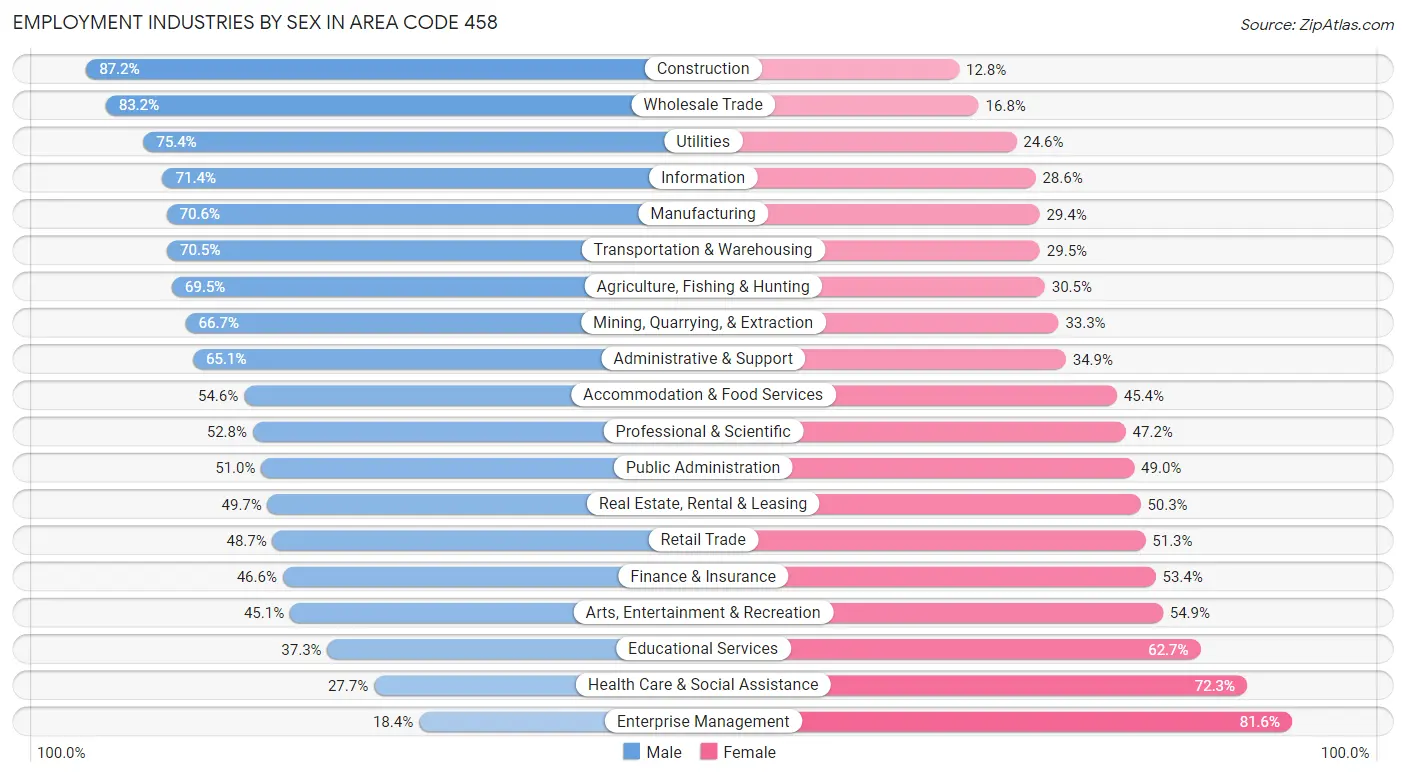
Employment Industries by Sex in Area Code 458
The Area Code 458 industries that see more men than women are Construction (87.2%), Wholesale Trade (83.2%), and Utilities (75.4%), whereas the industries that tend to have a higher number of women are Enterprise Management (81.6%), Health Care & Social Assistance (72.3%), and Educational Services (62.7%).
| Industry | Male | Female |
| Agriculture, Fishing & Hunting | 1,203 (69.5%) | 528 (30.5%) |
| Mining, Quarrying, & Extraction | 38 (66.7%) | 19 (33.3%) |
| Construction | 5,379 (87.2%) | 787 (12.8%) |
| Manufacturing | 5,236 (70.6%) | 2,182 (29.4%) |
| Wholesale Trade | 2,078 (83.2%) | 420 (16.8%) |
| Retail Trade | 6,673 (48.7%) | 7,035 (51.3%) |
| Transportation & Warehousing | 1,674 (70.5%) | 700 (29.5%) |
| Utilities | 420 (75.4%) | 137 (24.6%) |
| Information | 1,042 (71.4%) | 417 (28.6%) |
| Finance & Insurance | 1,615 (46.6%) | 1,853 (53.4%) |
| Real Estate, Rental & Leasing | 1,323 (49.7%) | 1,339 (50.3%) |
| Professional & Scientific | 4,086 (52.8%) | 3,658 (47.2%) |
| Enterprise Management | 18 (18.4%) | 80 (81.6%) |
| Administrative & Support | 2,495 (65.1%) | 1,335 (34.9%) |
| Educational Services | 5,440 (37.3%) | 9,135 (62.7%) |
| Health Care & Social Assistance | 4,493 (27.7%) | 11,738 (72.3%) |
| Arts, Entertainment & Recreation | 1,288 (45.1%) | 1,570 (54.9%) |
| Accommodation & Food Services | 5,437 (54.6%) | 4,524 (45.4%) |
| Public Administration | 2,038 (51.0%) | 1,958 (49.0%) |
| Total | 53,923 (50.9%) | 52,049 (49.1%) |
Education in Area Code 458
School Enrollment in Area Code 458
The most common levels of schooling among the 56,703 students in Area Code 458 are college / undergraduate (24,422 | 43.1%), high school (8,713 | 15.4%), and elementary school (7,826 | 13.8%).
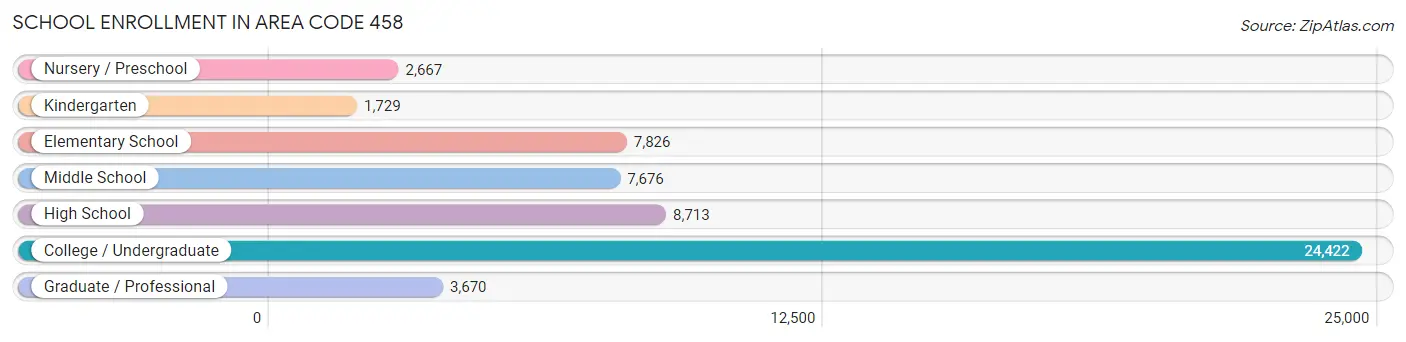
| School Level | # Students | % Students |
| Nursery / Preschool | 2,667 | 4.7% |
| Kindergarten | 1,729 | 3.0% |
| Elementary School | 7,826 | 13.8% |
| Middle School | 7,676 | 13.5% |
| High School | 8,713 | 15.4% |
| College / Undergraduate | 24,422 | 43.1% |
| Graduate / Professional | 3,670 | 6.5% |
| Total | 56,703 | 100.0% |
School Enrollment by Age by Funding Source in Area Code 458
Out of a total of 56,703 students who are enrolled in schools in Area Code 458, 6,291 (11.1%) attend a private institution, while the remaining 50,412 (88.9%) are enrolled in public schools. The age group of 3 to 4 year olds has the highest likelihood of being enrolled in private schools, with 1,235 (60.0% in the age bracket) enrolled. Conversely, the age group of 20 to 24 year olds has the lowest likelihood of being enrolled in a private school, with 14,196 (94.6% in the age bracket) attending a public institution.
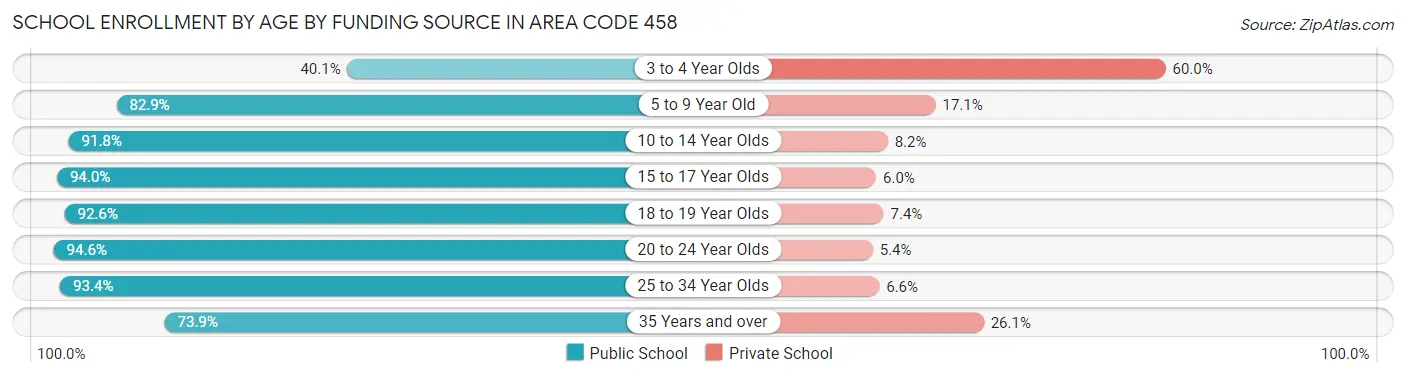
| Age Bracket | Public School | Private School |
| 3 to 4 Year Olds | 825 (40.1%) | 1,235 (60.0%) |
| 5 to 9 Year Old | 7,525 (82.9%) | 1,553 (17.1%) |
| 10 to 14 Year Olds | 8,900 (91.8%) | 795 (8.2%) |
| 15 to 17 Year Olds | 6,065 (94.0%) | 390 (6.0%) |
| 18 to 19 Year Olds | 7,128 (92.6%) | 573 (7.4%) |
| 20 to 24 Year Olds | 14,196 (94.6%) | 813 (5.4%) |
| 25 to 34 Year Olds | 3,916 (93.4%) | 278 (6.6%) |
| 35 Years and over | 1,856 (73.9%) | 655 (26.1%) |
| Total | 50,412 (88.9%) | 6,291 (11.1%) |
Educational Attainment by Field of Study in Area Code 458
Business (8,545 | 11.8%), social sciences (7,884 | 10.9%), education (7,420 | 10.2%), bio, nature & agricultural (6,878 | 9.5%), and science & technology (6,681 | 9.2%) are the most common fields of study among 72,529 individuals in Area Code 458 who have obtained a bachelor's degree or higher.
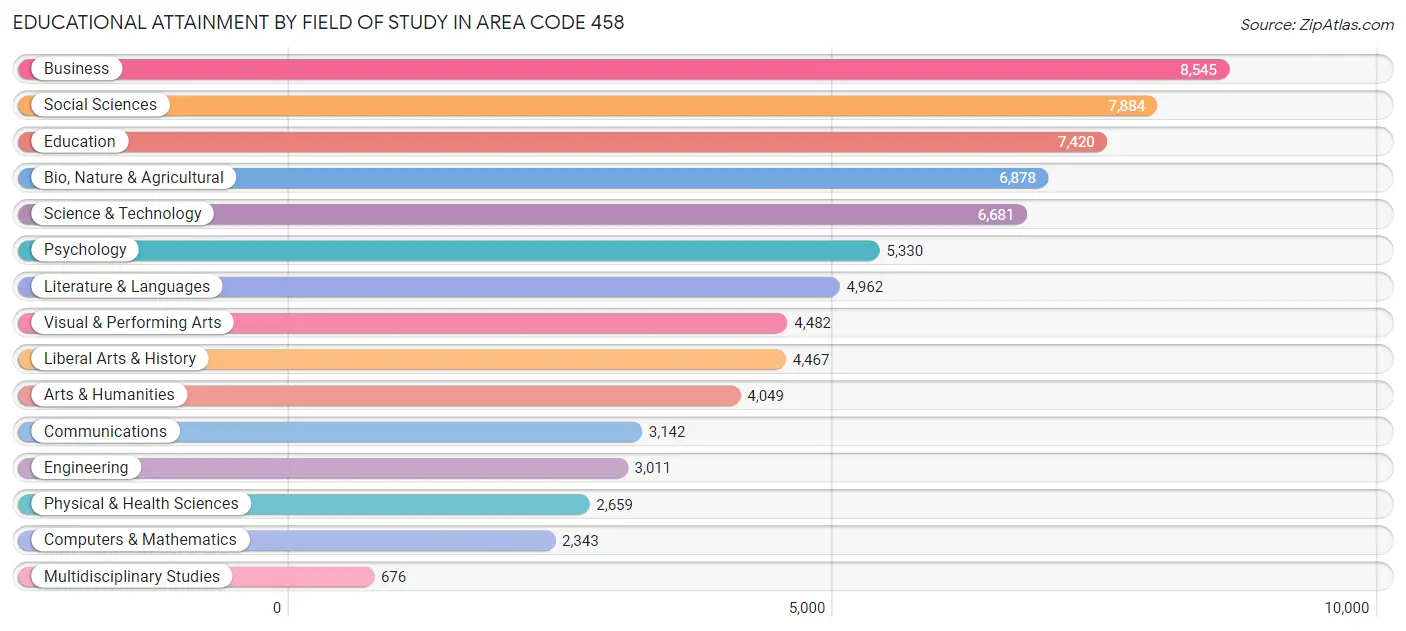
| Field of Study | # Graduates | % Graduates |
| Computers & Mathematics | 2,343 | 3.2% |
| Bio, Nature & Agricultural | 6,878 | 9.5% |
| Physical & Health Sciences | 2,659 | 3.7% |
| Psychology | 5,330 | 7.3% |
| Social Sciences | 7,884 | 10.9% |
| Engineering | 3,011 | 4.2% |
| Multidisciplinary Studies | 676 | 0.9% |
| Science & Technology | 6,681 | 9.2% |
| Business | 8,545 | 11.8% |
| Education | 7,420 | 10.2% |
| Literature & Languages | 4,962 | 6.8% |
| Liberal Arts & History | 4,467 | 6.2% |
| Visual & Performing Arts | 4,482 | 6.2% |
| Communications | 3,142 | 4.3% |
| Arts & Humanities | 4,049 | 5.6% |
| Total | 72,529 | 100.0% |
Transportation & Commute in Area Code 458
Vehicle Availability by Sex in Area Code 458
The most prevalent vehicle ownership categories in Area Code 458 are males with 2 vehicles (21,965, accounting for 41.7%) and females with 2 vehicles (20,582, making up 43.6%).
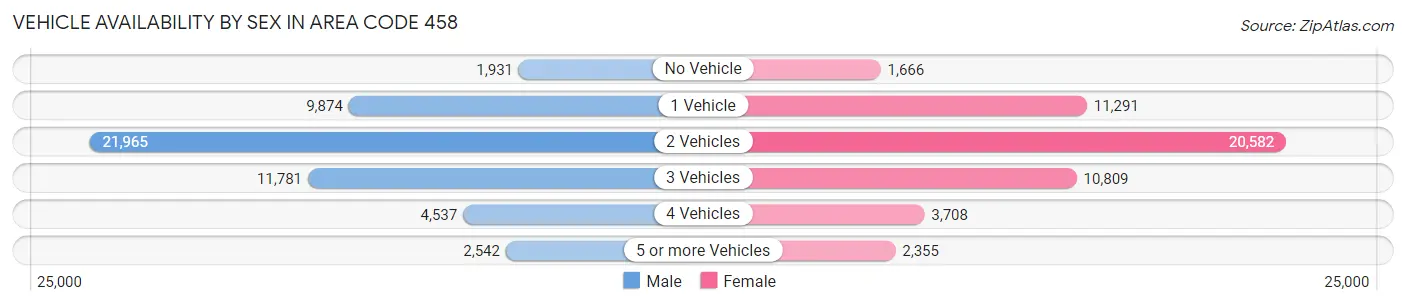
| Vehicles Available | Male | Female |
| No Vehicle | 1,931 (3.7%) | 1,666 (3.3%) |
| 1 Vehicle | 9,874 (18.8%) | 11,291 (22.4%) |
| 2 Vehicles | 21,965 (41.7%) | 20,582 (40.8%) |
| 3 Vehicles | 11,781 (22.4%) | 10,809 (21.4%) |
| 4 Vehicles | 4,537 (8.6%) | 3,708 (7.4%) |
| 5 or more Vehicles | 2,542 (4.8%) | 2,355 (4.7%) |
| Total | 52,630 (100.0%) | 50,411 (100.0%) |
Commute Time in Area Code 458
The most frequently occuring commute durations in Area Code 458 are 15 to 19 minutes (23,343 commuters, 26.7%), 10 to 14 minutes (21,631 commuters, 24.7%), and 5 to 9 minutes (13,212 commuters, 15.1%).
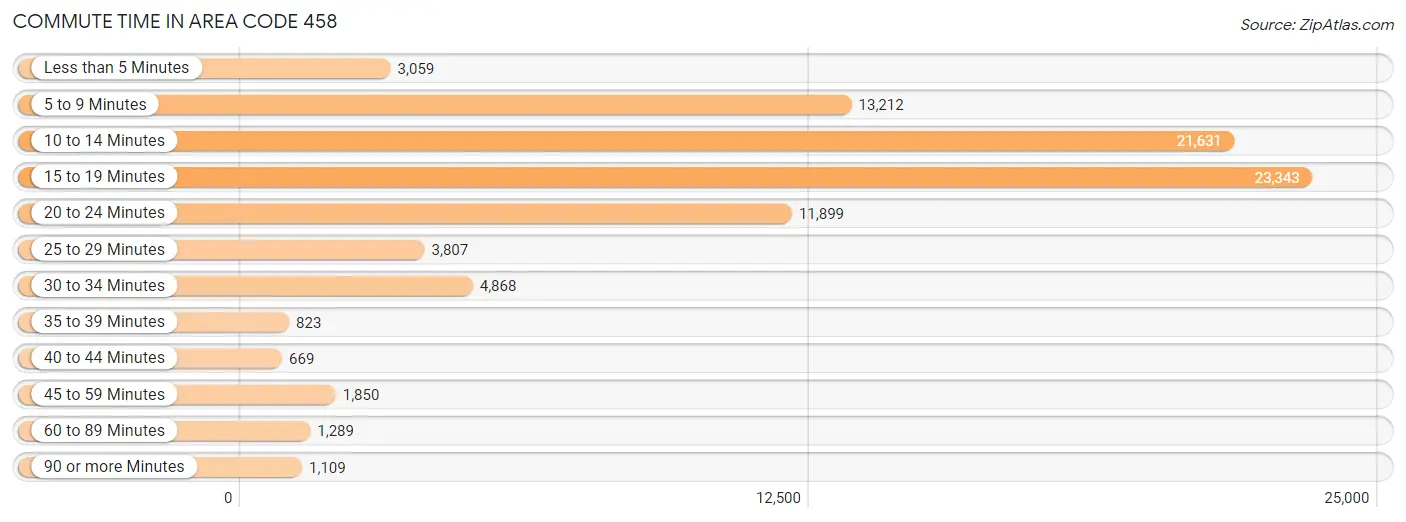
| Commute Time | # Commuters | % Commuters |
| Less than 5 Minutes | 3,059 | 3.5% |
| 5 to 9 Minutes | 13,212 | 15.1% |
| 10 to 14 Minutes | 21,631 | 24.7% |
| 15 to 19 Minutes | 23,343 | 26.7% |
| 20 to 24 Minutes | 11,899 | 13.6% |
| 25 to 29 Minutes | 3,807 | 4.3% |
| 30 to 34 Minutes | 4,868 | 5.6% |
| 35 to 39 Minutes | 823 | 0.9% |
| 40 to 44 Minutes | 669 | 0.8% |
| 45 to 59 Minutes | 1,850 | 2.1% |
| 60 to 89 Minutes | 1,289 | 1.5% |
| 90 or more Minutes | 1,109 | 1.3% |
Commute Time by Sex in Area Code 458
The most common commute times in Area Code 458 are 15 to 19 minutes (12,923 commuters, 28.6%) for males and 10 to 14 minutes (10,778 commuters, 25.5%) for females.
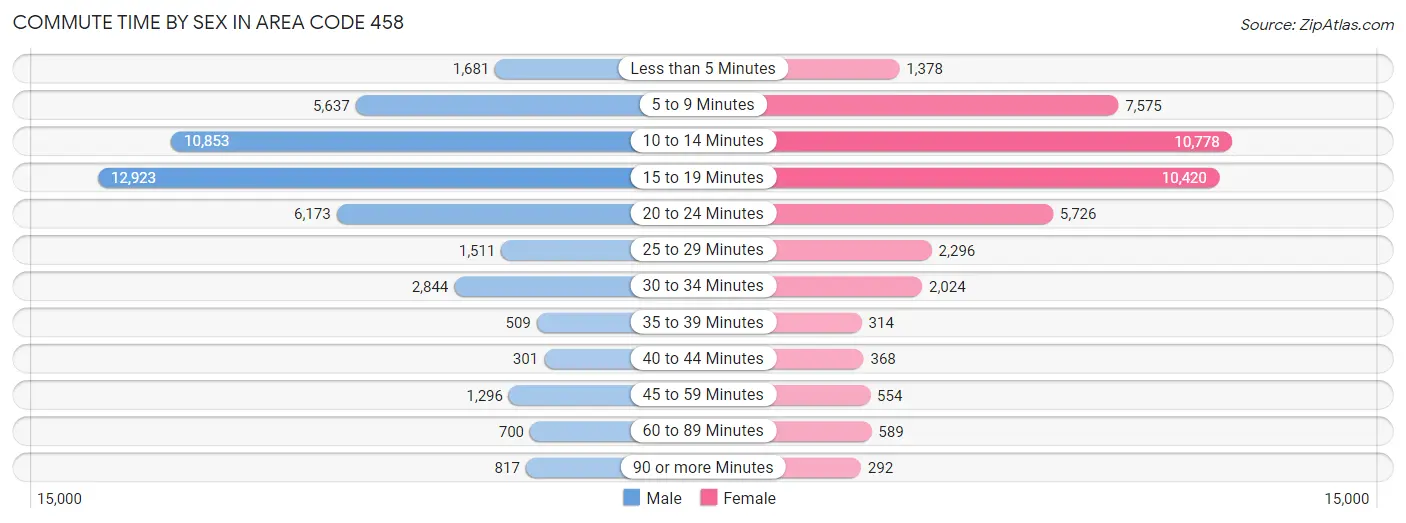
| Commute Time | Male | Female |
| Less than 5 Minutes | 1,681 (3.7%) | 1,378 (3.3%) |
| 5 to 9 Minutes | 5,637 (12.5%) | 7,575 (17.9%) |
| 10 to 14 Minutes | 10,853 (24.0%) | 10,778 (25.5%) |
| 15 to 19 Minutes | 12,923 (28.6%) | 10,420 (24.6%) |
| 20 to 24 Minutes | 6,173 (13.6%) | 5,726 (13.5%) |
| 25 to 29 Minutes | 1,511 (3.3%) | 2,296 (5.4%) |
| 30 to 34 Minutes | 2,844 (6.3%) | 2,024 (4.8%) |
| 35 to 39 Minutes | 509 (1.1%) | 314 (0.7%) |
| 40 to 44 Minutes | 301 (0.7%) | 368 (0.9%) |
| 45 to 59 Minutes | 1,296 (2.9%) | 554 (1.3%) |
| 60 to 89 Minutes | 700 (1.5%) | 589 (1.4%) |
| 90 or more Minutes | 817 (1.8%) | 292 (0.7%) |
Time of Departure to Work by Sex in Area Code 458
The most frequent times of departure to work in Area Code 458 are 7:30 AM to 7:59 AM (6,671, 14.7%) for males and 7:30 AM to 7:59 AM (7,317, 17.3%) for females.
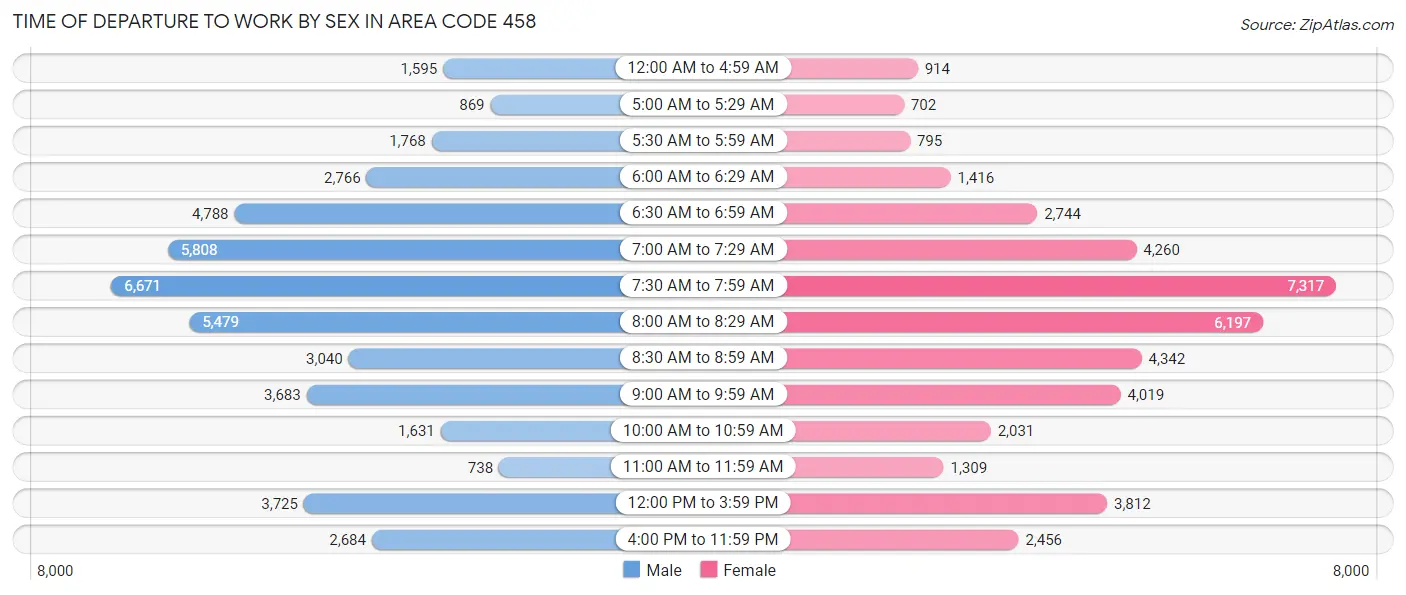
| Time of Departure | Male | Female |
| 12:00 AM to 4:59 AM | 1,595 (3.5%) | 914 (2.2%) |
| 5:00 AM to 5:29 AM | 869 (1.9%) | 702 (1.7%) |
| 5:30 AM to 5:59 AM | 1,768 (3.9%) | 795 (1.9%) |
| 6:00 AM to 6:29 AM | 2,766 (6.1%) | 1,416 (3.4%) |
| 6:30 AM to 6:59 AM | 4,788 (10.6%) | 2,744 (6.5%) |
| 7:00 AM to 7:29 AM | 5,808 (12.8%) | 4,260 (10.1%) |
| 7:30 AM to 7:59 AM | 6,671 (14.7%) | 7,317 (17.3%) |
| 8:00 AM to 8:29 AM | 5,479 (12.1%) | 6,197 (14.6%) |
| 8:30 AM to 8:59 AM | 3,040 (6.7%) | 4,342 (10.3%) |
| 9:00 AM to 9:59 AM | 3,683 (8.1%) | 4,019 (9.5%) |
| 10:00 AM to 10:59 AM | 1,631 (3.6%) | 2,031 (4.8%) |
| 11:00 AM to 11:59 AM | 738 (1.6%) | 1,309 (3.1%) |
| 12:00 PM to 3:59 PM | 3,725 (8.2%) | 3,812 (9.0%) |
| 4:00 PM to 11:59 PM | 2,684 (5.9%) | 2,456 (5.8%) |
| Total | 45,245 (100.0%) | 42,314 (100.0%) |
Housing Occupancy in Area Code 458
Occupancy by Ownership in Area Code 458
Of the total 88,833 dwellings in Area Code 458, owner-occupied units account for 49,057 (55.2%), while renter-occupied units make up 39,776 (44.8%).
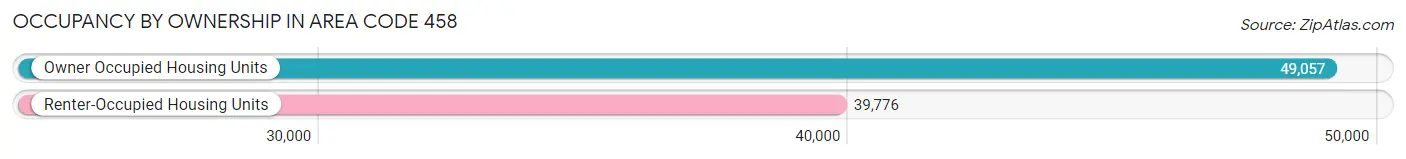
| Occupancy | # Housing Units | % Housing Units |
| Owner Occupied Housing Units | 49,057 | 55.2% |
| Renter-Occupied Housing Units | 39,776 | 44.8% |
| Total Occupied Housing Units | 88,833 | 100.0% |
Occupancy by Household Size in Area Code 458
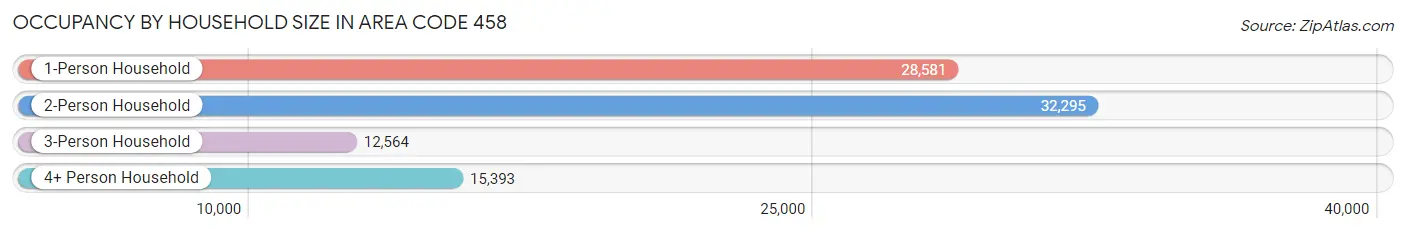
| Household Size | # Housing Units | % Housing Units |
| 1-Person Household | 28,581 | 32.2% |
| 2-Person Household | 32,295 | 36.3% |
| 3-Person Household | 12,564 | 14.1% |
| 4+ Person Household | 15,393 | 17.3% |
| Total Housing Units | 88,833 | 100.0% |
Occupancy by Ownership by Household Size in Area Code 458
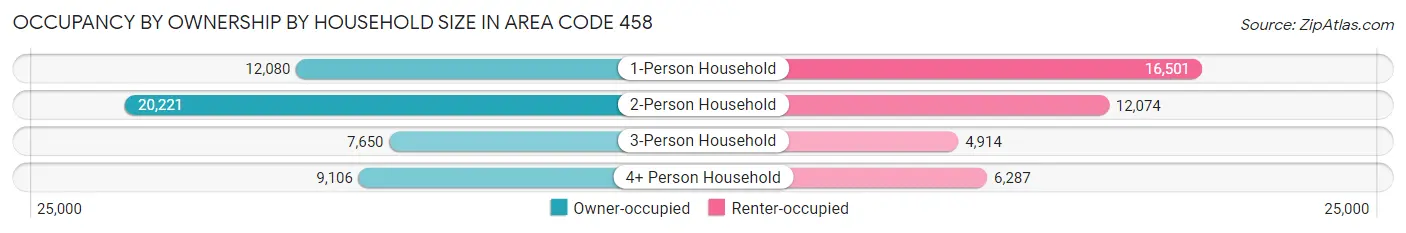
| Household Size | Owner-occupied | Renter-occupied |
| 1-Person Household | 12,080 (42.3%) | 16,501 (57.7%) |
| 2-Person Household | 20,221 (62.6%) | 12,074 (37.4%) |
| 3-Person Household | 7,650 (60.9%) | 4,914 (39.1%) |
| 4+ Person Household | 9,106 (59.2%) | 6,287 (40.8%) |
| Total Housing Units | 49,057 (55.2%) | 39,776 (44.8%) |
Occupancy by Educational Attainment in Area Code 458
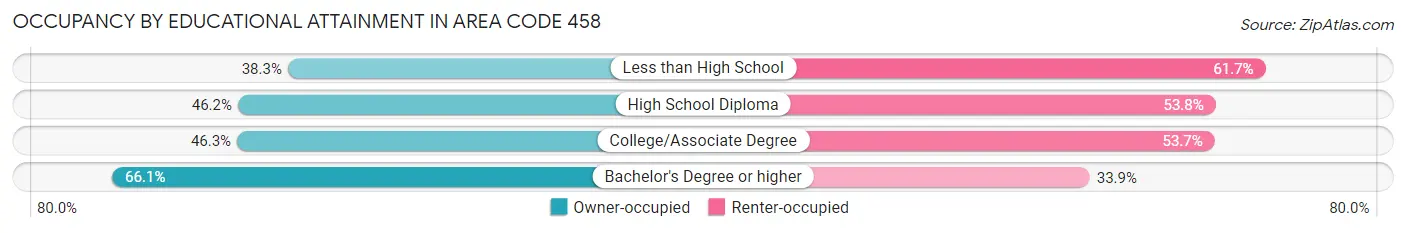
| Household Size | Owner-occupied | Renter-occupied |
| Less than High School | 1,311 (38.3%) | 2,116 (61.7%) |
| High School Diploma | 5,433 (46.2%) | 6,332 (53.8%) |
| College/Associate Degree | 14,919 (46.3%) | 17,290 (53.7%) |
| Bachelor's Degree or higher | 27,394 (66.1%) | 14,038 (33.9%) |
Occupancy by Age of Householder in Area Code 458
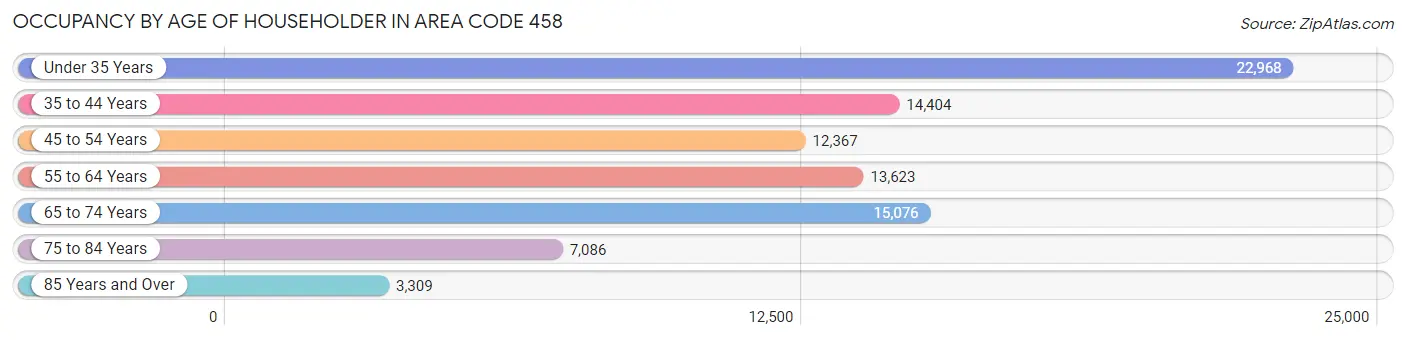
| Age Bracket | # Households | % Households |
| Under 35 Years | 22,968 | 25.9% |
| 35 to 44 Years | 14,404 | 16.2% |
| 45 to 54 Years | 12,367 | 13.9% |
| 55 to 64 Years | 13,623 | 15.3% |
| 65 to 74 Years | 15,076 | 17.0% |
| 75 to 84 Years | 7,086 | 8.0% |
| 85 Years and Over | 3,309 | 3.7% |
| Total | 88,833 | 100.0% |
Housing Finances in Area Code 458
Median Income by Occupancy in Area Code 458
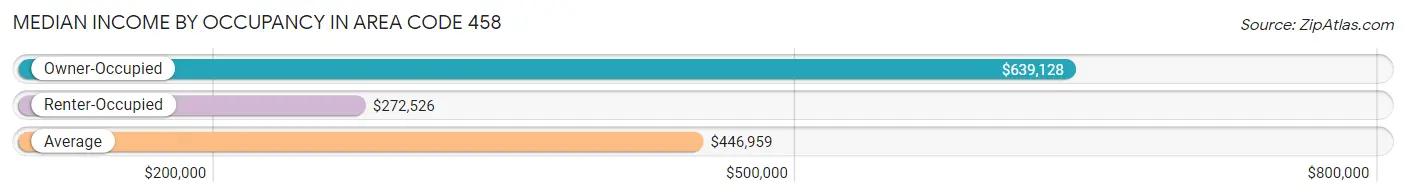
| Occupancy Type | # Households | Median Income |
| Owner-Occupied | 49,057 (55.2%) | $639,128 |
| Renter-Occupied | 39,776 (44.8%) | $272,526 |
| Average | 88,833 (100.0%) | $446,959 |
Occupancy by Householder Income Bracket in Area Code 458
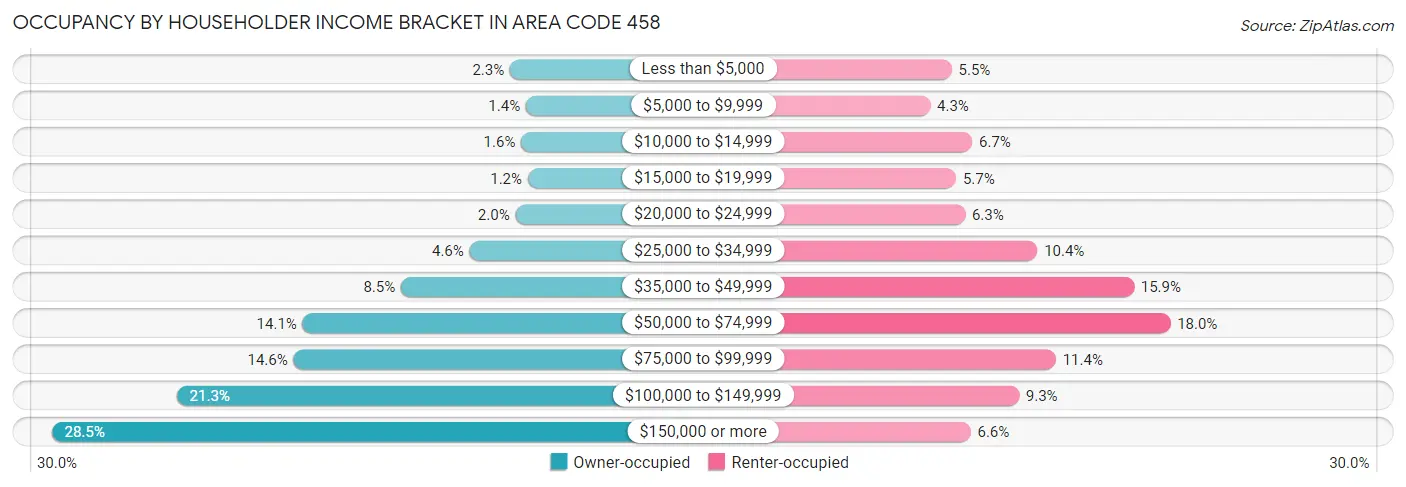
| Income Bracket | Owner-occupied | Renter-occupied |
| Less than $5,000 | 1,111 (2.3%) | 2,183 (5.5%) |
| $5,000 to $9,999 | 664 (1.3%) | 1,695 (4.3%) |
| $10,000 to $14,999 | 794 (1.6%) | 2,649 (6.7%) |
| $15,000 to $19,999 | 607 (1.2%) | 2,283 (5.7%) |
| $20,000 to $24,999 | 958 (1.9%) | 2,485 (6.2%) |
| $25,000 to $34,999 | 2,242 (4.6%) | 4,129 (10.4%) |
| $35,000 to $49,999 | 4,164 (8.5%) | 6,326 (15.9%) |
| $50,000 to $74,999 | 6,921 (14.1%) | 7,150 (18.0%) |
| $75,000 to $99,999 | 7,178 (14.6%) | 4,551 (11.4%) |
| $100,000 to $149,999 | 10,456 (21.3%) | 3,711 (9.3%) |
| $150,000 or more | 13,962 (28.5%) | 2,614 (6.6%) |
| Total | 49,057 (100.0%) | 39,776 (100.0%) |
Monthly Housing Cost Tiers in Area Code 458
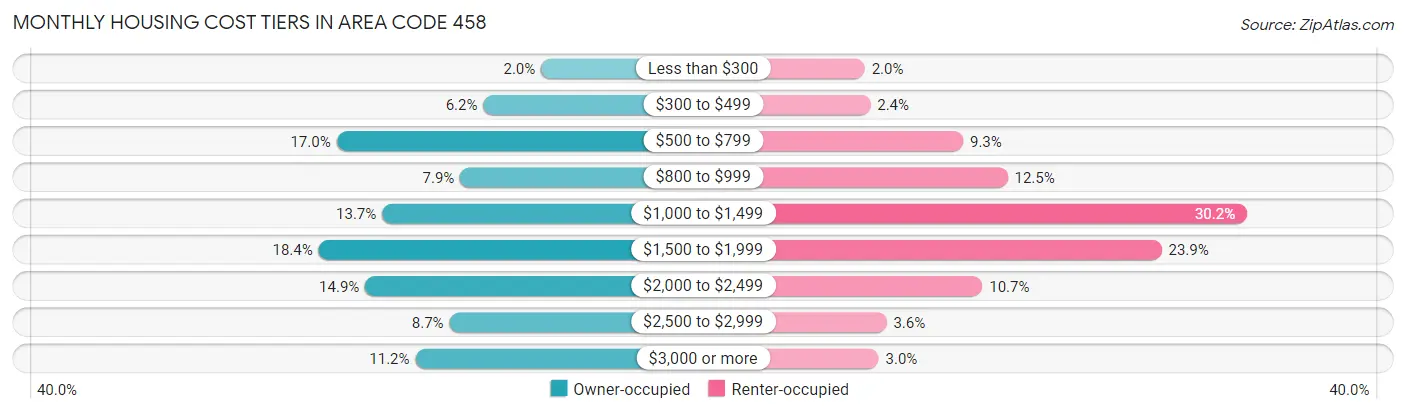
| Monthly Cost | Owner-occupied | Renter-occupied |
| Less than $300 | 961 (2.0%) | 798 (2.0%) |
| $300 to $499 | 3,050 (6.2%) | 964 (2.4%) |
| $500 to $799 | 8,356 (17.0%) | 3,680 (9.2%) |
| $800 to $999 | 3,887 (7.9%) | 4,984 (12.5%) |
| $1,000 to $1,499 | 6,706 (13.7%) | 11,998 (30.2%) |
| $1,500 to $1,999 | 9,001 (18.3%) | 9,494 (23.9%) |
| $2,000 to $2,499 | 7,320 (14.9%) | 4,243 (10.7%) |
| $2,500 to $2,999 | 4,273 (8.7%) | 1,434 (3.6%) |
| $3,000 or more | 5,503 (11.2%) | 1,204 (3.0%) |
| Total | 49,057 (100.0%) | 39,776 (100.0%) |
Physical Housing Characteristics in Area Code 458
Housing Structures in Area Code 458
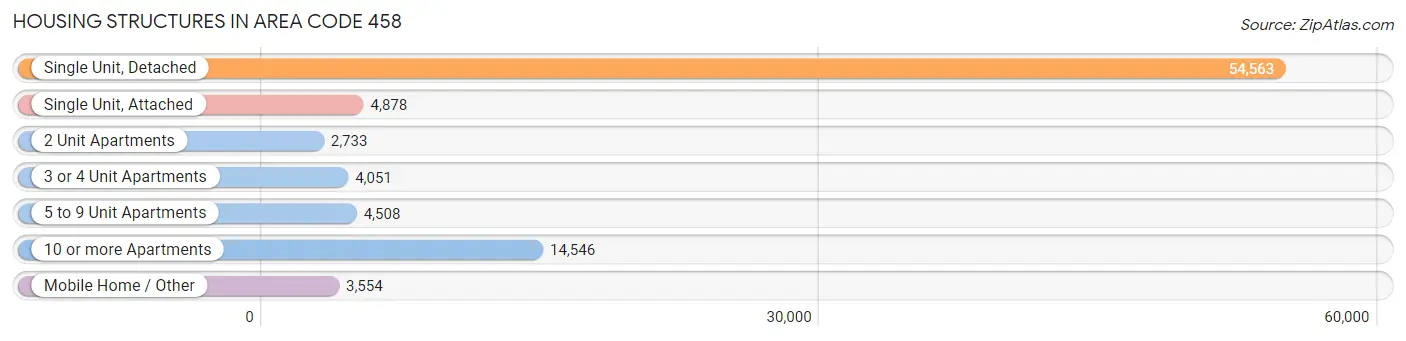
| Structure Type | # Housing Units | % Housing Units |
| Single Unit, Detached | 54,563 | 61.4% |
| Single Unit, Attached | 4,878 | 5.5% |
| 2 Unit Apartments | 2,733 | 3.1% |
| 3 or 4 Unit Apartments | 4,051 | 4.6% |
| 5 to 9 Unit Apartments | 4,508 | 5.1% |
| 10 or more Apartments | 14,546 | 16.4% |
| Mobile Home / Other | 3,554 | 4.0% |
| Total | 88,833 | 100.0% |
Housing Structures by Occupancy in Area Code 458
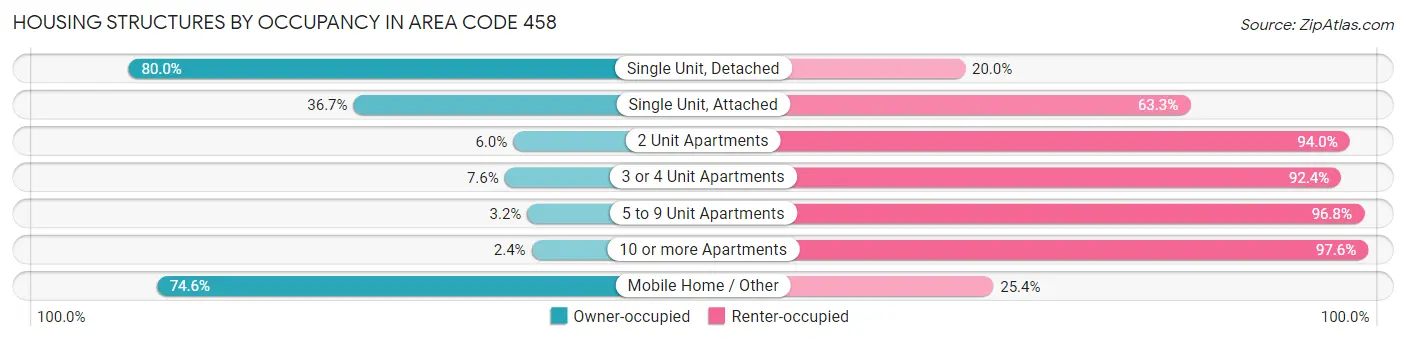
| Structure Type | Owner-occupied | Renter-occupied |
| Single Unit, Detached | 43,649 (80.0%) | 10,914 (20.0%) |
| Single Unit, Attached | 1,790 (36.7%) | 3,088 (63.3%) |
| 2 Unit Apartments | 163 (6.0%) | 2,570 (94.0%) |
| 3 or 4 Unit Apartments | 308 (7.6%) | 3,743 (92.4%) |
| 5 to 9 Unit Apartments | 146 (3.2%) | 4,362 (96.8%) |
| 10 or more Apartments | 351 (2.4%) | 14,195 (97.6%) |
| Mobile Home / Other | 2,650 (74.6%) | 904 (25.4%) |
| Total | 49,057 (55.2%) | 39,776 (44.8%) |
Housing Structures by Number of Rooms in Area Code 458
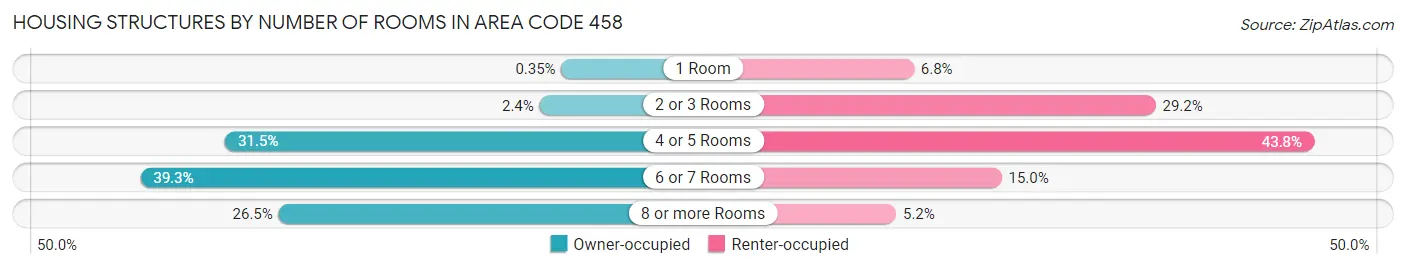
| Number of Rooms | Owner-occupied | Renter-occupied |
| 1 Room | 174 (0.4%) | 2,720 (6.8%) |
| 2 or 3 Rooms | 1,165 (2.4%) | 11,611 (29.2%) |
| 4 or 5 Rooms | 15,433 (31.5%) | 17,434 (43.8%) |
| 6 or 7 Rooms | 19,278 (39.3%) | 5,948 (14.9%) |
| 8 or more Rooms | 13,007 (26.5%) | 2,063 (5.2%) |
| Total | 49,057 (100.0%) | 39,776 (100.0%) |
Housing Structure by Heating Type in Area Code 458
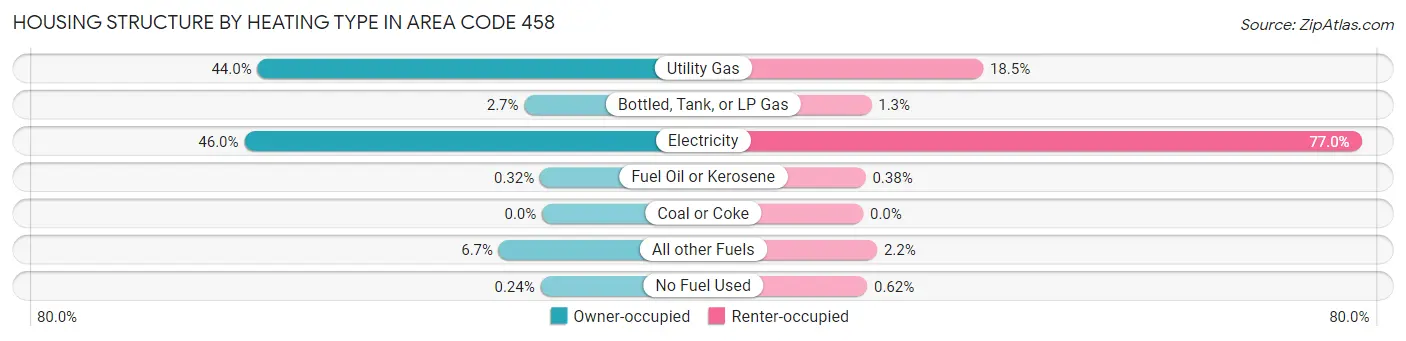
| Heating Type | Owner-occupied | Renter-occupied |
| Utility Gas | 21,585 (44.0%) | 7,376 (18.5%) |
| Bottled, Tank, or LP Gas | 1,343 (2.7%) | 504 (1.3%) |
| Electricity | 22,580 (46.0%) | 30,642 (77.0%) |
| Fuel Oil or Kerosene | 156 (0.3%) | 151 (0.4%) |
| Coal or Coke | 0 (0.0%) | 0 (0.0%) |
| All other Fuels | 3,276 (6.7%) | 857 (2.1%) |
| No Fuel Used | 117 (0.2%) | 246 (0.6%) |
| Total | 49,057 (100.0%) | 39,776 (100.0%) |
Household Vehicle Usage in Area Code 458
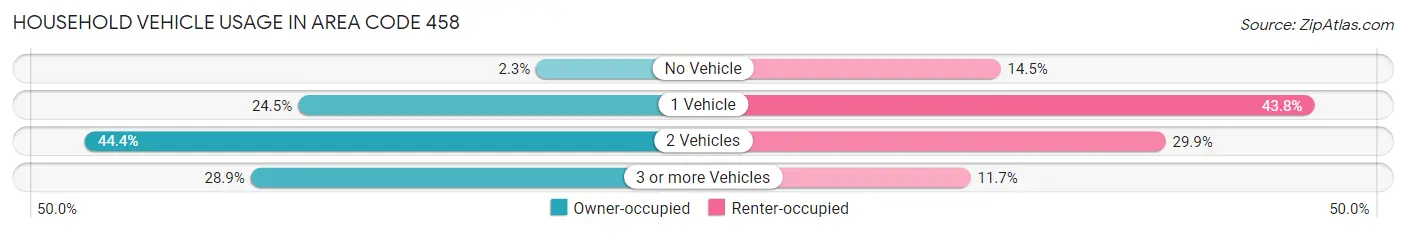
| Vehicles per Household | Owner-occupied | Renter-occupied |
| No Vehicle | 1,111 (2.3%) | 5,784 (14.5%) |
| 1 Vehicle | 12,007 (24.5%) | 17,420 (43.8%) |
| 2 Vehicles | 21,758 (44.4%) | 11,906 (29.9%) |
| 3 or more Vehicles | 14,181 (28.9%) | 4,666 (11.7%) |
| Total | 49,057 (100.0%) | 39,776 (100.0%) |
Real Estate & Mortgages in Area Code 458
Real Estate and Mortgage Overview in Area Code 458
| Characteristic | Without Mortgage | With Mortgage |
| Housing Units | 17,058 | 31,999 |
| Median Property Value | $2,873,700 | $3,218,600 |
| Median Household Income | $393,871 | $10,737 |
| Monthly Housing Costs | $4,303 | $5,472 |
| Real Estate Taxes | $26,465 | $438 |
Property Value by Mortgage Status in Area Code 458
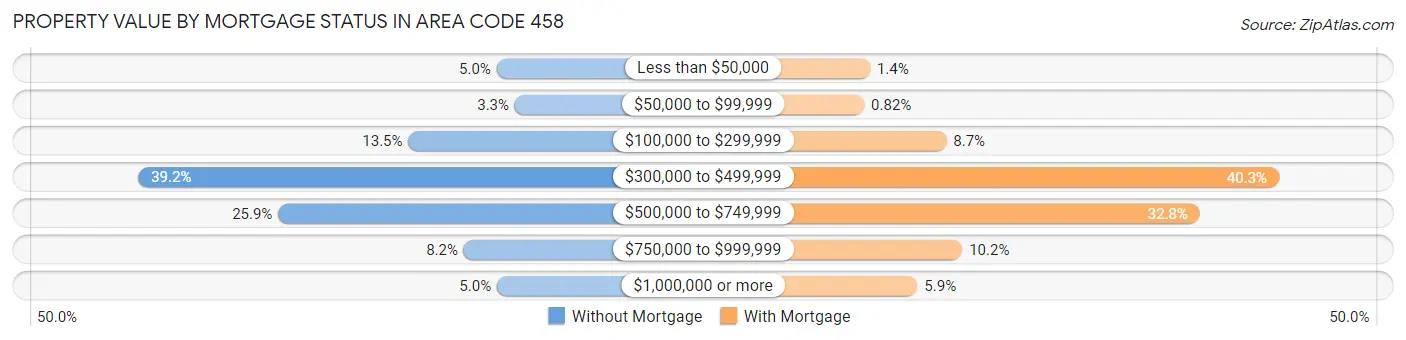
| Property Value | Without Mortgage | With Mortgage |
| Less than $50,000 | 859 (5.0%) | 437 (1.4%) |
| $50,000 to $99,999 | 564 (3.3%) | 262 (0.8%) |
| $100,000 to $299,999 | 2,295 (13.5%) | 2,768 (8.6%) |
| $300,000 to $499,999 | 6,683 (39.2%) | 12,901 (40.3%) |
| $500,000 to $749,999 | 4,410 (25.9%) | 10,494 (32.8%) |
| $750,000 to $999,999 | 1,393 (8.2%) | 3,251 (10.2%) |
| $1,000,000 or more | 854 (5.0%) | 1,886 (5.9%) |
| Total | 17,058 (100.0%) | 31,999 (100.0%) |
Household Income by Mortgage Status in Area Code 458
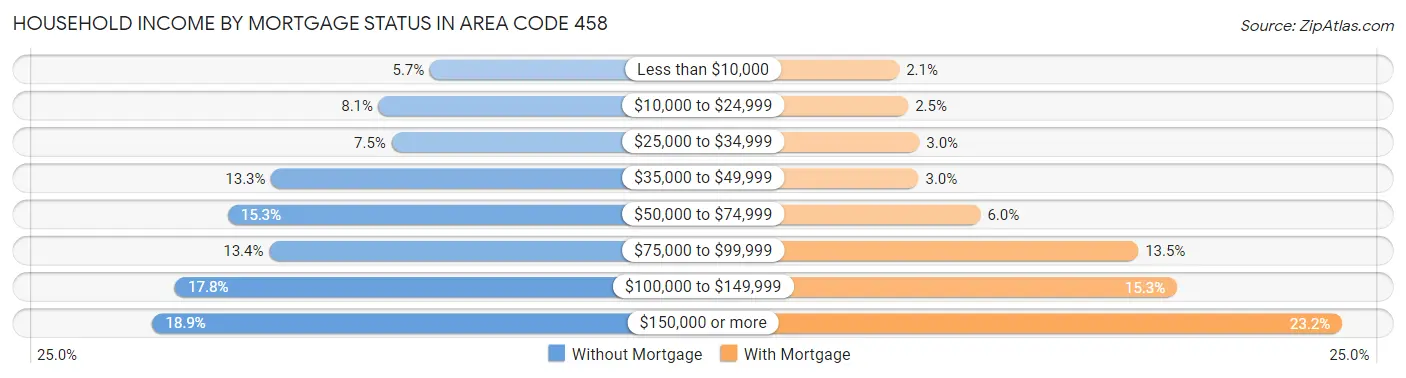
| Household Income | Without Mortgage | With Mortgage |
| Less than $10,000 | 971 (5.7%) | 664 (2.1%) |
| $10,000 to $24,999 | 1,387 (8.1%) | 804 (2.5%) |
| $25,000 to $34,999 | 1,282 (7.5%) | 972 (3.0%) |
| $35,000 to $49,999 | 2,260 (13.3%) | 960 (3.0%) |
| $50,000 to $74,999 | 2,614 (15.3%) | 1,904 (5.9%) |
| $75,000 to $99,999 | 2,278 (13.4%) | 4,307 (13.5%) |
| $100,000 to $149,999 | 3,041 (17.8%) | 4,900 (15.3%) |
| $150,000 or more | 3,225 (18.9%) | 7,415 (23.2%) |
| Total | 17,058 (100.0%) | 31,999 (100.0%) |
Property Value to Household Income Ratio in Area Code 458
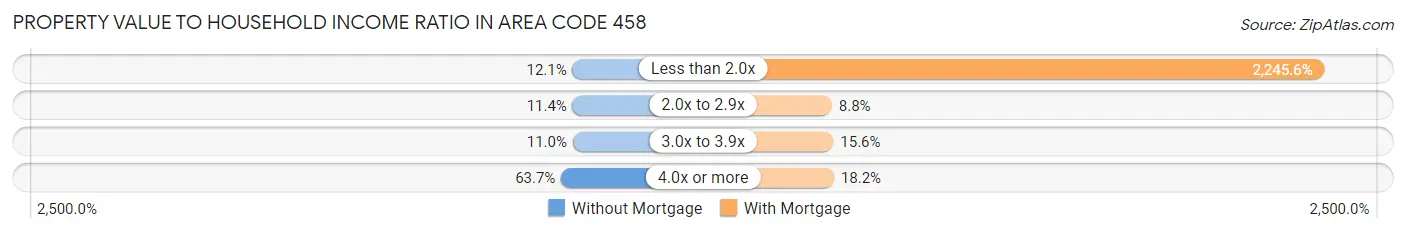
| Value-to-Income Ratio | Without Mortgage | With Mortgage |
| Less than 2.0x | 2,070 (12.1%) | 718,561 (2,245.6%) |
| 2.0x to 2.9x | 1,951 (11.4%) | 2,804 (8.8%) |
| 3.0x to 3.9x | 1,881 (11.0%) | 4,988 (15.6%) |
| 4.0x or more | 10,871 (63.7%) | 5,827 (18.2%) |
| Total | 17,058 (100.0%) | 31,999 (100.0%) |
Real Estate Taxes by Mortgage Status in Area Code 458
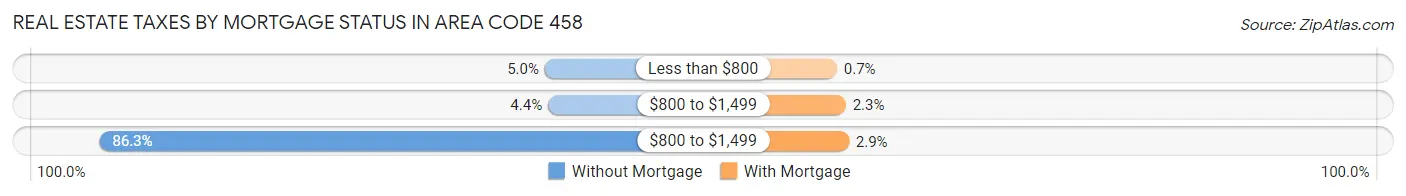
| Property Taxes | Without Mortgage | With Mortgage |
| Less than $800 | 852 (5.0%) | 224 (0.7%) |
| $800 to $1,499 | 751 (4.4%) | 741 (2.3%) |
| $800 to $1,499 | 14,728 (86.3%) | 924 (2.9%) |
| Total | 17,058 (100.0%) | 31,999 (100.0%) |
Health & Disability in Area Code 458
Health Insurance Coverage by Age in Area Code 458
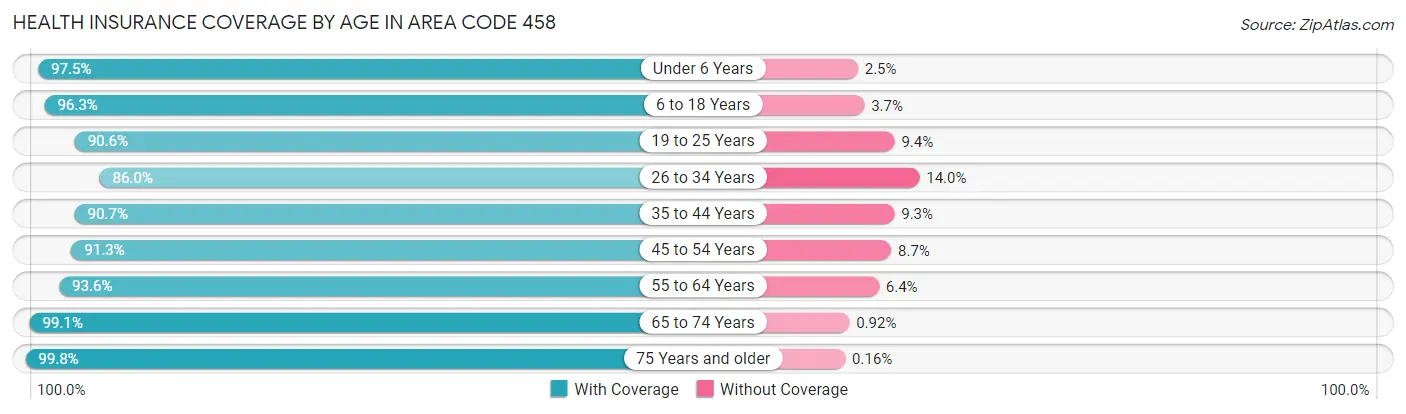
| Age Bracket | With Coverage | Without Coverage |
| Under 6 Years | 10,262 (97.5%) | 264 (2.5%) |
| 6 to 18 Years | 27,788 (96.3%) | 1,072 (3.7%) |
| 19 to 25 Years | 29,418 (90.6%) | 3,038 (9.4%) |
| 26 to 34 Years | 21,800 (86.0%) | 3,542 (14.0%) |
| 35 to 44 Years | 23,931 (90.7%) | 2,460 (9.3%) |
| 45 to 54 Years | 21,329 (91.3%) | 2,041 (8.7%) |
| 55 to 64 Years | 21,424 (93.6%) | 1,475 (6.4%) |
| 65 to 74 Years | 23,302 (99.1%) | 217 (0.9%) |
| 75 Years and older | 15,736 (99.8%) | 25 (0.2%) |
| Total | 194,990 (93.2%) | 14,134 (6.8%) |
Health Insurance Coverage by Citizenship Status in Area Code 458
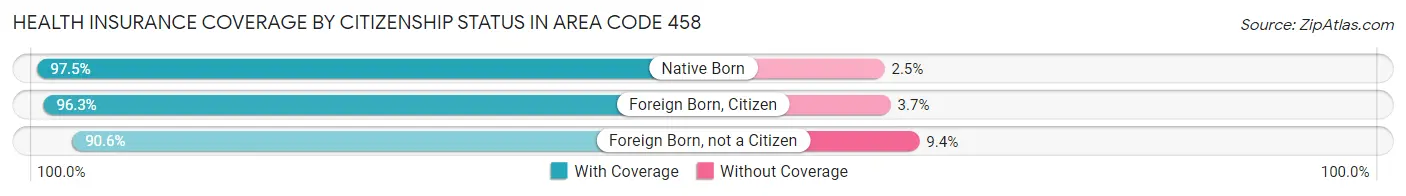
| Citizenship Status | With Coverage | Without Coverage |
| Native Born | 10,262 (97.5%) | 264 (2.5%) |
| Foreign Born, Citizen | 27,788 (96.3%) | 1,072 (3.7%) |
| Foreign Born, not a Citizen | 29,418 (90.6%) | 3,038 (9.4%) |
Health Insurance Coverage by Household Income in Area Code 458
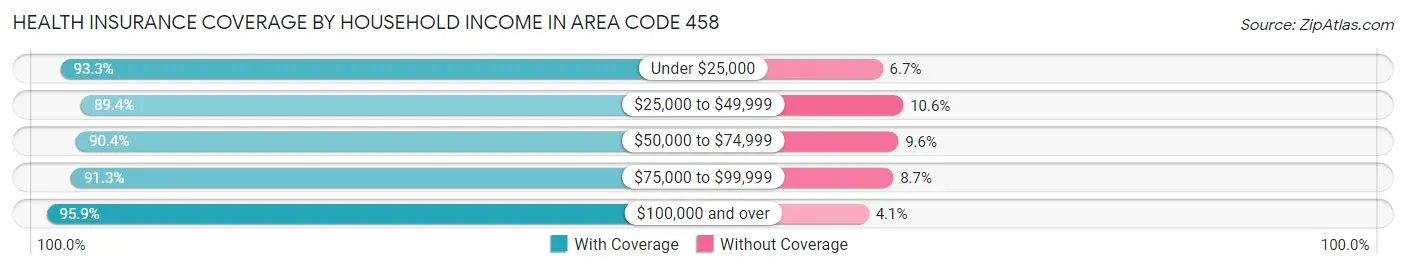
| Household Income | With Coverage | Without Coverage |
| Under $25,000 | 22,982 (93.3%) | 1,655 (6.7%) |
| $25,000 to $49,999 | 29,403 (89.4%) | 3,474 (10.6%) |
| $50,000 to $74,999 | 26,544 (90.4%) | 2,833 (9.6%) |
| $75,000 to $99,999 | 25,913 (91.3%) | 2,468 (8.7%) |
| $100,000 and over | 84,556 (95.9%) | 3,616 (4.1%) |
Public vs Private Health Insurance Coverage by Age in Area Code 458
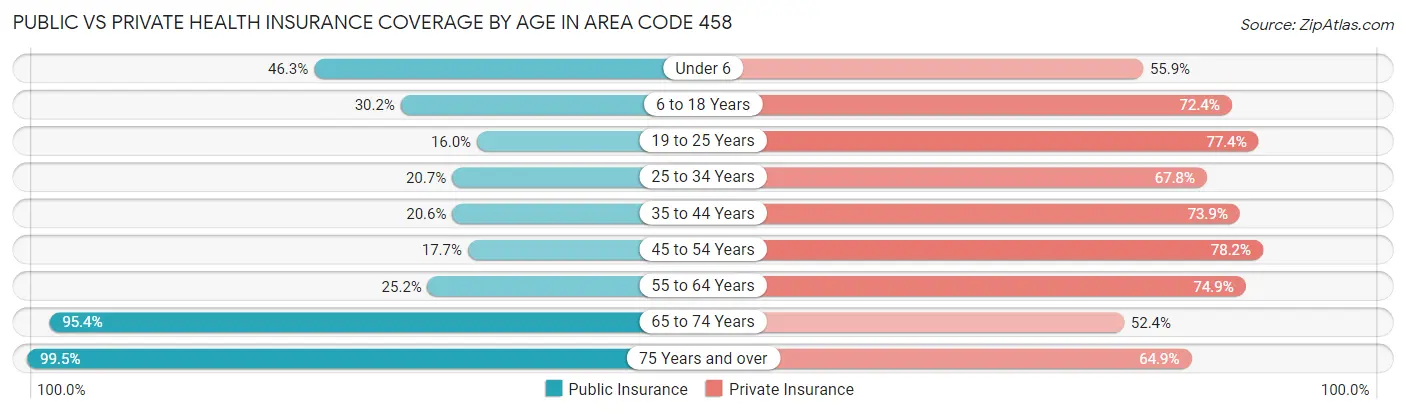
| Age Bracket | Public Insurance | Private Insurance |
| Under 6 | 4,871 (46.3%) | 5,884 (55.9%) |
| 6 to 18 Years | 8,713 (30.2%) | 20,883 (72.4%) |
| 19 to 25 Years | 5,206 (16.0%) | 25,106 (77.3%) |
| 25 to 34 Years | 5,239 (20.7%) | 17,171 (67.8%) |
| 35 to 44 Years | 5,438 (20.6%) | 19,493 (73.9%) |
| 45 to 54 Years | 4,146 (17.7%) | 18,264 (78.1%) |
| 55 to 64 Years | 5,769 (25.2%) | 17,160 (74.9%) |
| 65 to 74 Years | 22,442 (95.4%) | 12,313 (52.3%) |
| 75 Years and over | 15,689 (99.5%) | 10,225 (64.9%) |
| Total | 77,513 (37.1%) | 146,499 (70.1%) |
Disability Status by Sex by Age in Area Code 458
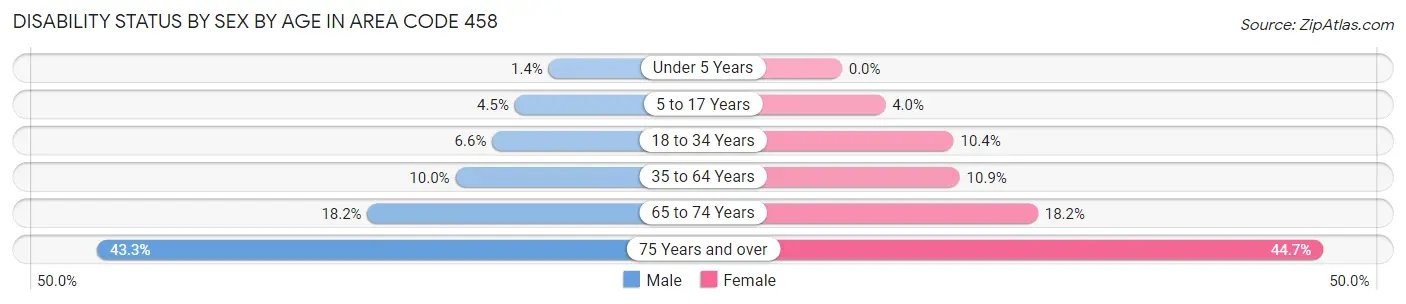
| Age Bracket | Male | Female |
| Under 5 Years | 59 (1.4%) | 0 (0.0%) |
| 5 to 17 Years | 613 (4.5%) | 532 (4.0%) |
| 18 to 34 Years | 1,989 (6.6%) | 3,295 (10.4%) |
| 35 to 64 Years | 3,682 (10.0%) | 3,931 (10.9%) |
| 65 to 74 Years | 2,071 (18.2%) | 2,206 (18.2%) |
| 75 Years and over | 2,914 (43.3%) | 4,031 (44.7%) |
Disability Class by Sex by Age in Area Code 458
Disability Class: Hearing Difficulty
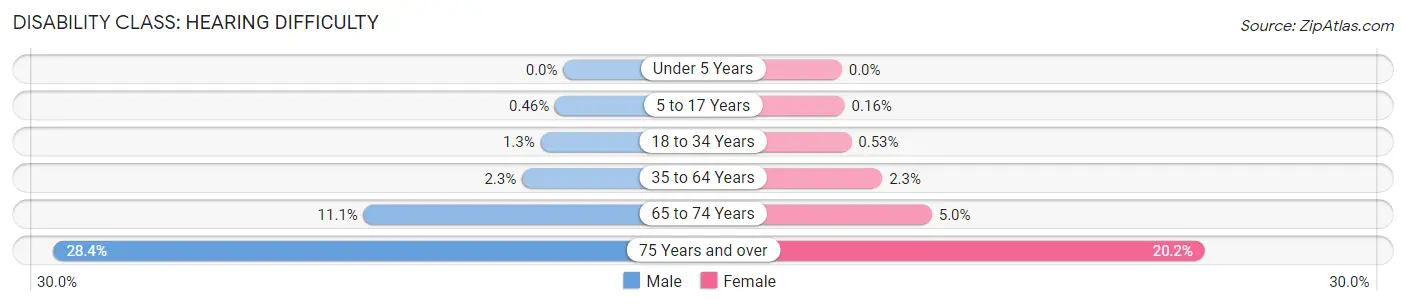
| Age Bracket | Male | Female |
| Under 5 Years | 0 (0.0%) | 0 (0.0%) |
| 5 to 17 Years | 63 (0.5%) | 21 (0.2%) |
| 18 to 34 Years | 383 (1.3%) | 170 (0.5%) |
| 35 to 64 Years | 846 (2.3%) | 809 (2.2%) |
| 65 to 74 Years | 1,267 (11.1%) | 607 (5.0%) |
| 75 Years and over | 1,912 (28.4%) | 1,824 (20.2%) |
Disability Class: Vision Difficulty
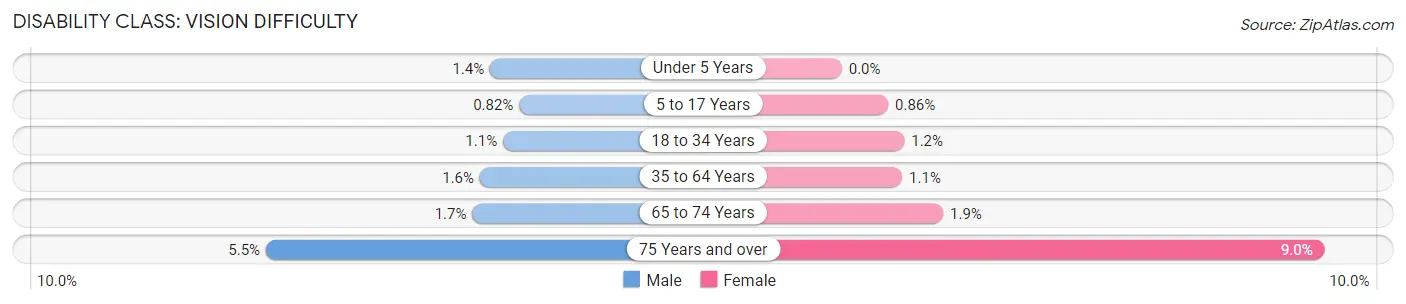
| Age Bracket | Male | Female |
| Under 5 Years | 59 (1.4%) | 0 (0.0%) |
| 5 to 17 Years | 112 (0.8%) | 114 (0.9%) |
| 18 to 34 Years | 337 (1.1%) | 369 (1.2%) |
| 35 to 64 Years | 571 (1.5%) | 403 (1.1%) |
| 65 to 74 Years | 193 (1.7%) | 228 (1.9%) |
| 75 Years and over | 372 (5.5%) | 809 (9.0%) |
Disability Class: Cognitive Difficulty
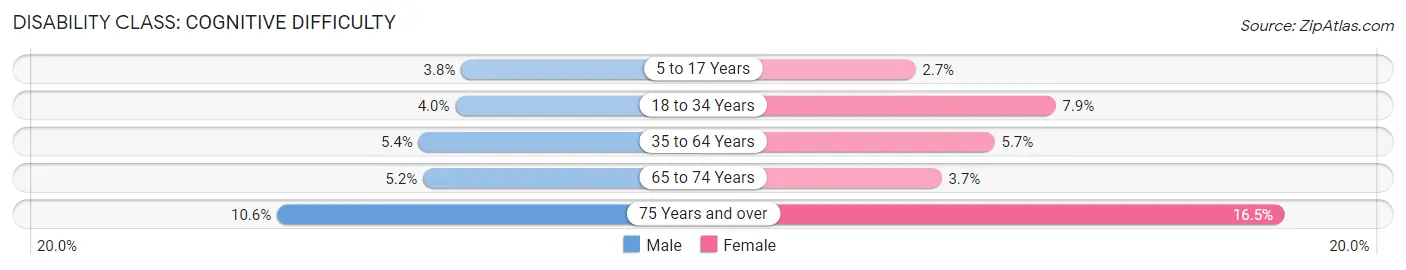
| Age Bracket | Male | Female |
| 5 to 17 Years | 515 (3.8%) | 360 (2.7%) |
| 18 to 34 Years | 1,209 (4.0%) | 2,520 (7.9%) |
| 35 to 64 Years | 1,973 (5.4%) | 2,036 (5.7%) |
| 65 to 74 Years | 594 (5.2%) | 449 (3.7%) |
| 75 Years and over | 716 (10.6%) | 1,485 (16.5%) |
Disability Class: Ambulatory Difficulty
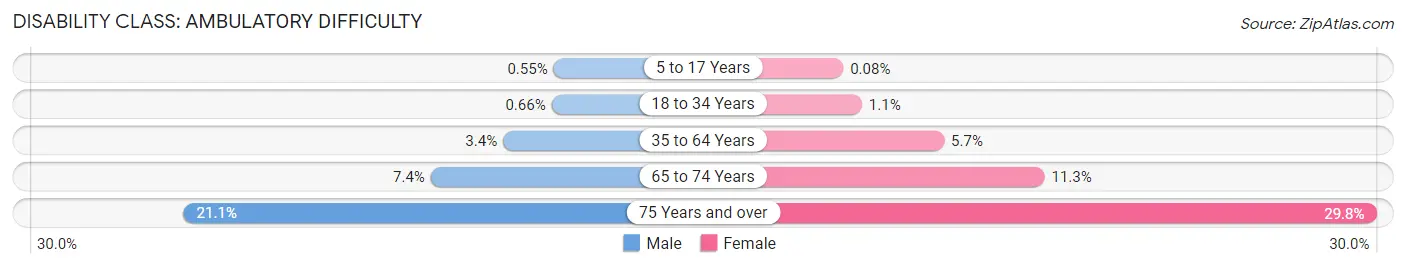
| Age Bracket | Male | Female |
| 5 to 17 Years | 75 (0.5%) | 10 (0.1%) |
| 18 to 34 Years | 199 (0.7%) | 356 (1.1%) |
| 35 to 64 Years | 1,233 (3.4%) | 2,048 (5.7%) |
| 65 to 74 Years | 842 (7.4%) | 1,369 (11.3%) |
| 75 Years and over | 1,424 (21.1%) | 2,686 (29.8%) |
Disability Class: Self-Care Difficulty
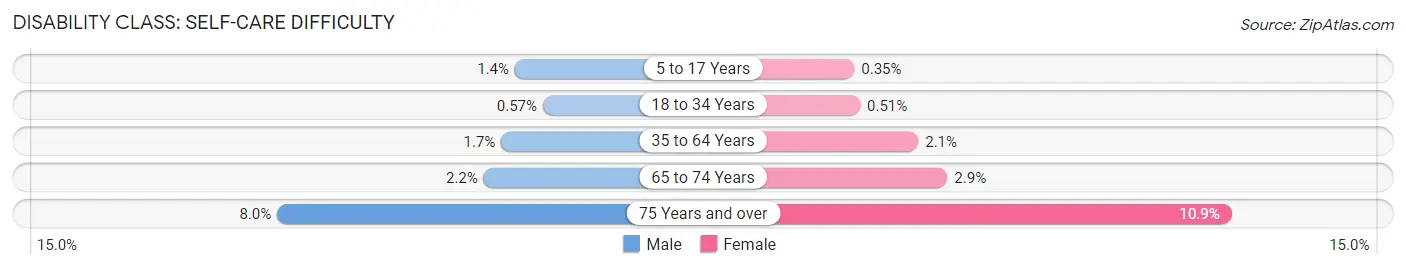
| Age Bracket | Male | Female |
| 5 to 17 Years | 184 (1.3%) | 46 (0.4%) |
| 18 to 34 Years | 171 (0.6%) | 163 (0.5%) |
| 35 to 64 Years | 636 (1.7%) | 764 (2.1%) |
| 65 to 74 Years | 253 (2.2%) | 356 (2.9%) |
| 75 Years and over | 537 (8.0%) | 979 (10.8%) |
Technology Access in Area Code 458
Computing Device Access in Area Code 458
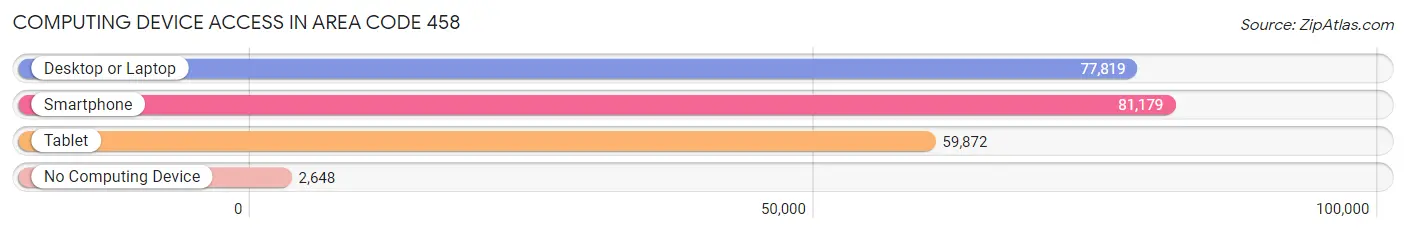
| Device Type | # Households | % Households |
| Desktop or Laptop | 77,819 | 87.6% |
| Smartphone | 81,179 | 91.4% |
| Tablet | 59,872 | 67.4% |
| No Computing Device | 2,648 | 3.0% |
| Total | 88,833 | 100.0% |
Internet Access in Area Code 458
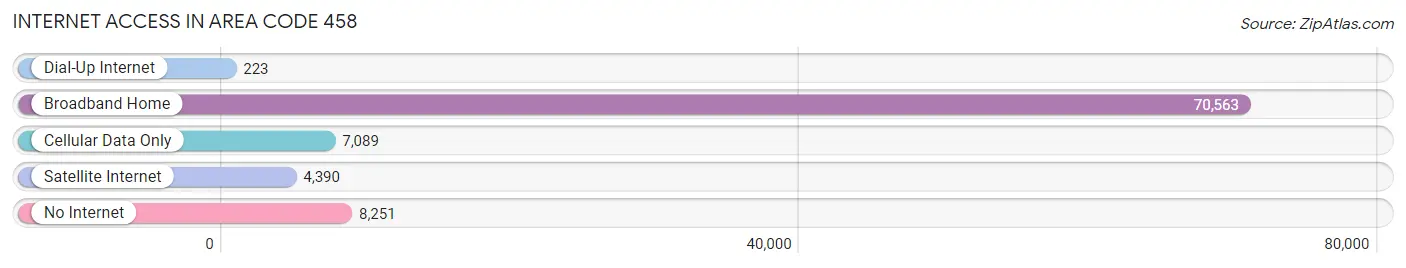
| Internet Type | # Households | % Households |
| Dial-Up Internet | 223 | 0.3% |
| Broadband Home | 70,563 | 79.4% |
| Cellular Data Only | 7,089 | 8.0% |
| Satellite Internet | 4,390 | 4.9% |
| No Internet | 8,251 | 9.3% |
| Total | 88,833 | 100.0% |
Area Code 458 Summary
Geography
Area code 458 is located in the state of Oregon. It covers the western part of the state, including the cities of Eugene, Corvallis, and Salem.
Social
Area code 458 is home to a diverse population of people from all walks of life. The area is known for its vibrant arts and culture scene, with a variety of music, theater, and visual arts venues.
Economics
Area code 458 is home to a number of major employers, including the University of Oregon, Oregon State University, and the state government. The area is also home to a number of tech companies, such as Intel and Hewlett Packard.
Demographics
Area code 458 is home to a population of over 1.5 million people. The population is diverse, with a mix of races and ethnicities. The median household income is around $50,000, and the median age is around 35.
Common Questions
What is Per Capita Income in Area Code 458?
Per Capita income in Area Code 458 is $39,182.
What is the Median Family Income in Area Code 458?
Median Family Income in Area Code 458 is $91,521.
What is the Median Household income in Area Code 458?
Median Household Income in Area Code 458 is $63,851.
What is Income or Wage Gap in Area Code 458?
Income or Wage Gap in Area Code 458 is 30.1%.
Women in Area Code 458 earn 69.9 cents for every dollar earned by a man.
What is Family Income Deficit in Area Code 458?
Family Income Deficit in Area Code 458 is $11,392.
Families that are below poverty line in Area Code 458 earn $11,392 less on average than the poverty threshold level.
What is Inequality or Gini Index in Area Code 458?
Inequality or Gini Index in Area Code 458 is 3.22.
What is the Total Population of Area Code 458?
Total Population of Area Code 458 is 210,563.
What is the Total Male Population of Area Code 458?
Total Male Population of Area Code 458 is 103,872.
What is the Total Female Population of Area Code 458?
Total Female Population of Area Code 458 is 106,691.
What is the Ratio of Males per 100 Females in Area Code 458?
There are 97.36 Males per 100 Females in Area Code 458.
What is the Ratio of Females per 100 Males in Area Code 458?
There are 102.71 Females per 100 Males in Area Code 458.
What is the Median Population Age in Area Code 458?
Median Population Age in Area Code 458 is 39.5 Years.
What is the Average Family Size in Area Code 458
Average Family Size in Area Code 458 is 2.8 People.
What is the Average Household Size in Area Code 458
Average Household Size in Area Code 458 is 2.3 People.
How Large is the Labor Force in Area Code 458?
There are 109,433 People in the Labor Forcein in Area Code 458.
What is the Percentage of People in the Labor Force in Area Code 458?
60.9% of People are in the Labor Force in Area Code 458.
What is the Unemployment Rate in Area Code 458?
Unemployment Rate in Area Code 458 is 6.1%.