Zip Codes with the Highest Percentage of Not-for-profit Organizations in Rochester, NY

RELATED REPORTS & OPTIONS

Not-for-profit Organizations
Population
Families and Households
Female Fertility
Female Fertility (Unmarried)
Race (Community Size)
Race (Percentage)
Ancestry (Community Size)
AfghanAfricanAlbanianAlsatianAmericanApacheArabArgentineanArmenianAustralianAustrianBahamianBarbadianBasqueBelgianBelizeanBhutaneseBlackfeetBolivianBrazilianBritishBritish West IndianBulgarianBurmeseCambodianCanadianCape VerdeanCelticCentral AmericanCentral American IndianCherokeeChileanChippewaChoctawColombianCosta RicanCroatianCubanCzechCzechoslovakianDanishDominicanDutchEastern EuropeanEcuadorianEgyptianEnglishEstonianEthiopianEuropeanFilipinoFinnishFrenchFrench CanadianGermanGhanaianGreekGuamanian / ChamorroGuatemalanGuyaneseHaitianHonduranHungarianIcelanderIndian (Asian)IndonesianIranianIraqiIrishIroquoisIsraeliItalianJamaicanJapaneseKenyanKoreanLatvianLebaneseLiberianLithuanianLuxembourgerMacedonianMalaysianMexicanMexican American IndianMongolianMoroccanNative HawaiianNavajoNicaraguanNigerianNorthern EuropeanNorwegianPakistaniPalestinianPanamanianParaguayanPennsylvania GermanPeruvianPolishPortuguesePuebloPuerto RicanRomanianRussianSalvadoranSamoanScandinavianScotch-IrishScottishSeminoleSerbianSlavicSlovakSloveneSomaliSouth AfricanSouth AmericanSouth American IndianSpaniardSpanishSri LankanSubsaharan AfricanSudaneseSwedishSwissSyrianThaiTrinidadian and TobagonianTurkishU.S. Virgin IslanderUkrainianVenezuelanVietnameseWelshWest IndianYugoslavianZimbabwean
Ancestry (Percentage)
AfghanAfricanAlbanianAlsatianAmericanApacheArabArgentineanArmenianAustralianAustrianBahamianBarbadianBasqueBelgianBelizeanBhutaneseBlackfeetBolivianBrazilianBritishBritish West IndianBulgarianBurmeseCambodianCanadianCape VerdeanCelticCentral AmericanCentral American IndianCherokeeChileanChippewaChoctawColombianCosta RicanCroatianCubanCzechCzechoslovakianDanishDominicanDutchEastern EuropeanEcuadorianEgyptianEnglishEstonianEthiopianEuropeanFilipinoFinnishFrenchFrench CanadianGermanGhanaianGreekGuamanian / ChamorroGuatemalanGuyaneseHaitianHonduranHungarianIcelanderIndian (Asian)IndonesianIranianIraqiIrishIroquoisIsraeliItalianJamaicanJapaneseKenyanKoreanLatvianLebaneseLiberianLithuanianLuxembourgerMacedonianMalaysianMexicanMexican American IndianMongolianMoroccanNative HawaiianNavajoNicaraguanNigerianNorthern EuropeanNorwegianPakistaniPalestinianPanamanianParaguayanPennsylvania GermanPeruvianPolishPortuguesePuebloPuerto RicanRomanianRussianSalvadoranSamoanScandinavianScotch-IrishScottishSeminoleSerbianSlavicSlovakSloveneSomaliSouth AfricanSouth AmericanSouth American IndianSpaniardSpanishSri LankanSubsaharan AfricanSudaneseSwedishSwissSyrianThaiTrinidadian and TobagonianTurkishU.S. Virgin IslanderUkrainianVenezuelanVietnameseWelshWest IndianYugoslavianZimbabwean
Immigrant Origin (Total)
AfghanistanAfricaAlbaniaArgentinaArmeniaAsiaAustraliaAustriaBangladeshBarbadosBelarusBelgiumBelizeBoliviaBosnia and HerzegovinaBrazilBulgariaBurma / MyanmarCambodiaCameroonCanadaCaribbeanCentral AmericaChileChinaColombiaCongoCosta RicaCroatiaCubaCzechoslovakiaDominican RepublicEastern AfricaEastern AsiaEastern EuropeEcuadorEgyptEl SalvadorEnglandEritreaEthiopiaEuropeFranceGermanyGhanaGreeceGrenadaGuatemalaGuyanaHaitiHondurasHong KongHungaryIndiaIranIraqIrelandIsraelItalyJamaicaJapanKazakhstanKenyaKoreaKuwaitLaosLatin AmericaLebanonLiberiaLithuaniaMalaysiaMexicoMiddle AfricaMoldovaMoroccoNepalNetherlandsNicaraguaNigeriaNorth MacedoniaNorthern AfricaNorthern EuropeOceaniaPakistanPanamaPeruPhilippinesPolandPortugalRomaniaRussiaSaudi ArabiaScotlandSenegalSerbiaSingaporeSomaliaSouth AfricaSouth AmericaSouth Central AsiaSouth Eastern AsiaSouthern EuropeSpainSri LankaSudanSwedenSyriaTaiwanThailandTrinidad and TobagoTurkeyUgandaUkraineUzbekistanVenezuelaVietnamWestern AfricaWestern AsiaWestern EuropeYemenZaireZimbabwe
Immigrant Origin (Percentage)
AfghanistanAfricaAlbaniaArgentinaArmeniaAsiaAustraliaAustriaBangladeshBarbadosBelarusBelgiumBelizeBoliviaBosnia and HerzegovinaBrazilBulgariaBurma / MyanmarCambodiaCameroonCanadaCaribbeanCentral AmericaChileChinaColombiaCongoCosta RicaCroatiaCubaCzechoslovakiaDominican RepublicEastern AfricaEastern AsiaEastern EuropeEcuadorEgyptEl SalvadorEnglandEritreaEthiopiaEuropeFranceGermanyGhanaGreeceGrenadaGuatemalaGuyanaHaitiHondurasHong KongHungaryIndiaIranIraqIrelandIsraelItalyJamaicaJapanKazakhstanKenyaKoreaKuwaitLaosLatin AmericaLebanonLiberiaLithuaniaMalaysiaMexicoMiddle AfricaMoldovaMoroccoNepalNetherlandsNicaraguaNigeriaNorth MacedoniaNorthern AfricaNorthern EuropeOceaniaPakistanPanamaPeruPhilippinesPolandPortugalRomaniaRussiaSaudi ArabiaScotlandSenegalSerbiaSingaporeSomaliaSouth AfricaSouth AmericaSouth Central AsiaSouth Eastern AsiaSouthern EuropeSpainSri LankaSudanSwedenSyriaTaiwanThailandTrinidad and TobagoTurkeyUgandaUkraineUzbekistanVenezuelaVietnamWestern AfricaWestern AsiaWestern EuropeYemenZaireZimbabwe
Income
Income (Families)
Income (Households)
Poverty
Poverty (Families)
Unemployment
Employment Occupations
Employment Industries
Employer Class
Commute Time
Commute Means
School Enrollment
Education by Degree Field
Occupancy
Finances
Physical Characteristics
Rochester
Compare Zip Codes
Comparison Subject

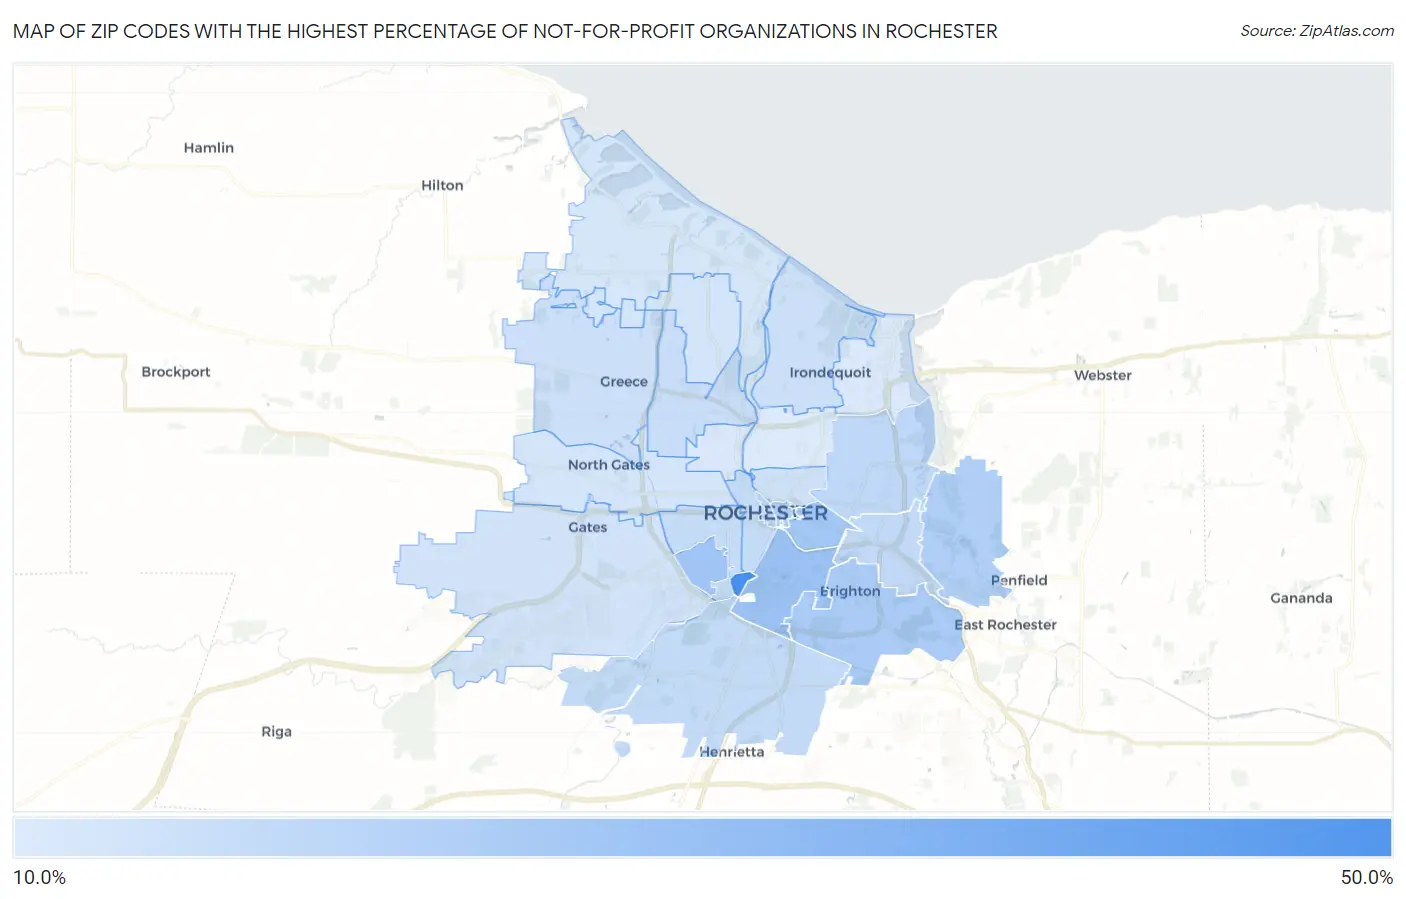
Map of Zip Codes with the Highest Percentage of Not-for-profit Organizations in Rochester

0.0%
50.0%
Zip Codes with the Highest Percentage of Not-for-profit Organizations in Rochester Map

Zip Codes with the Highest Percentage of Not-for-profit Organizations in Rochester, NY

Zip Code % Employed in Not-for-profit vs State vs National
1.1462747.3%11.3%(+36.0)#188.4%(+38.9)#164
2.1462026.1%11.3%(+14.8)#718.4%(+17.7)#624
3.1461925.1%11.3%(+13.8)#808.4%(+16.7)#689
4.1460724.3%11.3%(+13.0)#868.4%(+15.9)#749
5.1461823.2%11.3%(+11.9)#988.4%(+14.8)#853
6.1460421.8%11.3%(+10.4)#1168.4%(+13.3)#1,037
7.1462521.4%11.3%(+10.0)#1278.4%(+12.9)#1,098
8.1461418.9%11.3%(+7.57)#1798.4%(+10.5)#1,503
9.1460918.4%11.3%(+7.06)#1878.4%(+9.96)#1,604
10.1461018.0%11.3%(+6.62)#1968.4%(+9.52)#1,721
11.1462317.4%11.3%(+6.03)#2218.4%(+8.93)#1,907
12.1461117.2%11.3%(+5.87)#2278.4%(+8.77)#1,955
13.1460816.8%11.3%(+5.40)#2528.4%(+8.31)#2,123
14.1461516.5%11.3%(+5.14)#2638.4%(+8.04)#2,238
15.1462615.6%11.3%(+4.22)#3028.4%(+7.12)#2,644
16.1461715.3%11.3%(+3.95)#3248.4%(+6.85)#2,776
17.1460515.2%11.3%(+3.88)#3288.4%(+6.78)#2,811
18.1462414.4%11.3%(+3.07)#3818.4%(+5.97)#3,295
19.1460614.1%11.3%(+2.74)#4048.4%(+5.64)#3,514
20.1461614.0%11.3%(+2.61)#4228.4%(+5.51)#3,630
21.1461213.4%11.3%(+2.06)#4798.4%(+4.96)#4,106
22.1461312.7%11.3%(+1.39)#5498.4%(+4.29)#4,788
23.1462212.7%11.3%(+1.35)#5518.4%(+4.25)#4,844
24.1462112.2%11.3%(+0.843)#6028.4%(+3.75)#5,382

Common Questions

What are the Top 10 Zip Codes with the Highest Percentage of Not-for-profit Organizations in Rochester, NY?
Top 10 Zip Codes with the Highest Percentage of Not-for-profit Organizations in Rochester, NY are:
#1
47.3%
#2
26.1%
#3
25.1%
#4
24.3%
#5
23.2%
#6
21.8%
#7
21.4%
#8
18.9%
#9
18.4%
#10
18.0%
What zip code has the Highest Percentage of Not-for-profit Organizations in Rochester, NY?
14627 has the Highest Percentage of Not-for-profit Organizations in Rochester, NY with 47.3%.
What is the Percentage of Not-for-profit Organizations in Rochester, NY?
Percentage of Not-for-profit Organizations in Rochester is 18.8%.
What is the Percentage of Not-for-profit Organizations in New York?
Percentage of Not-for-profit Organizations in New York is 11.3%.
What is the Percentage of Not-for-profit Organizations in the United States?
Percentage of Not-for-profit Organizations in the United States is 8.4%.