Zip Codes with the Lowest Percentage of Owner-Occupied Units in Rochester, NY

RELATED REPORTS & OPTIONS

Lowest Owner-Occupied
Population
Families and Households
Female Fertility
Female Fertility (Unmarried)
Race (Community Size)
Race (Percentage)
Ancestry (Community Size)
AfghanAfricanAlbanianAlsatianAmericanApacheArabArgentineanArmenianAustralianAustrianBahamianBarbadianBasqueBelgianBelizeanBhutaneseBlackfeetBolivianBrazilianBritishBritish West IndianBulgarianBurmeseCambodianCanadianCape VerdeanCelticCentral AmericanCentral American IndianCherokeeChileanChippewaChoctawColombianCosta RicanCroatianCubanCzechCzechoslovakianDanishDominicanDutchEastern EuropeanEcuadorianEgyptianEnglishEstonianEthiopianEuropeanFilipinoFinnishFrenchFrench CanadianGermanGhanaianGreekGuamanian / ChamorroGuatemalanGuyaneseHaitianHonduranHungarianIcelanderIndian (Asian)IndonesianIranianIraqiIrishIroquoisIsraeliItalianJamaicanJapaneseKenyanKoreanLatvianLebaneseLiberianLithuanianLuxembourgerMacedonianMalaysianMexicanMexican American IndianMongolianMoroccanNative HawaiianNavajoNicaraguanNigerianNorthern EuropeanNorwegianPakistaniPalestinianPanamanianParaguayanPennsylvania GermanPeruvianPolishPortuguesePuebloPuerto RicanRomanianRussianSalvadoranSamoanScandinavianScotch-IrishScottishSeminoleSerbianSlavicSlovakSloveneSomaliSouth AfricanSouth AmericanSouth American IndianSpaniardSpanishSri LankanSubsaharan AfricanSudaneseSwedishSwissSyrianThaiTrinidadian and TobagonianTurkishU.S. Virgin IslanderUkrainianVenezuelanVietnameseWelshWest IndianYugoslavianZimbabwean
Ancestry (Percentage)
AfghanAfricanAlbanianAlsatianAmericanApacheArabArgentineanArmenianAustralianAustrianBahamianBarbadianBasqueBelgianBelizeanBhutaneseBlackfeetBolivianBrazilianBritishBritish West IndianBulgarianBurmeseCambodianCanadianCape VerdeanCelticCentral AmericanCentral American IndianCherokeeChileanChippewaChoctawColombianCosta RicanCroatianCubanCzechCzechoslovakianDanishDominicanDutchEastern EuropeanEcuadorianEgyptianEnglishEstonianEthiopianEuropeanFilipinoFinnishFrenchFrench CanadianGermanGhanaianGreekGuamanian / ChamorroGuatemalanGuyaneseHaitianHonduranHungarianIcelanderIndian (Asian)IndonesianIranianIraqiIrishIroquoisIsraeliItalianJamaicanJapaneseKenyanKoreanLatvianLebaneseLiberianLithuanianLuxembourgerMacedonianMalaysianMexicanMexican American IndianMongolianMoroccanNative HawaiianNavajoNicaraguanNigerianNorthern EuropeanNorwegianPakistaniPalestinianPanamanianParaguayanPennsylvania GermanPeruvianPolishPortuguesePuebloPuerto RicanRomanianRussianSalvadoranSamoanScandinavianScotch-IrishScottishSeminoleSerbianSlavicSlovakSloveneSomaliSouth AfricanSouth AmericanSouth American IndianSpaniardSpanishSri LankanSubsaharan AfricanSudaneseSwedishSwissSyrianThaiTrinidadian and TobagonianTurkishU.S. Virgin IslanderUkrainianVenezuelanVietnameseWelshWest IndianYugoslavianZimbabwean
Immigrant Origin (Total)
AfghanistanAfricaAlbaniaArgentinaArmeniaAsiaAustraliaAustriaBangladeshBarbadosBelarusBelgiumBelizeBoliviaBosnia and HerzegovinaBrazilBulgariaBurma / MyanmarCambodiaCameroonCanadaCaribbeanCentral AmericaChileChinaColombiaCongoCosta RicaCroatiaCubaCzechoslovakiaDominican RepublicEastern AfricaEastern AsiaEastern EuropeEcuadorEgyptEl SalvadorEnglandEritreaEthiopiaEuropeFranceGermanyGhanaGreeceGrenadaGuatemalaGuyanaHaitiHondurasHong KongHungaryIndiaIranIraqIrelandIsraelItalyJamaicaJapanKazakhstanKenyaKoreaKuwaitLaosLatin AmericaLebanonLiberiaLithuaniaMalaysiaMexicoMiddle AfricaMoldovaMoroccoNepalNetherlandsNicaraguaNigeriaNorth MacedoniaNorthern AfricaNorthern EuropeOceaniaPakistanPanamaPeruPhilippinesPolandPortugalRomaniaRussiaSaudi ArabiaScotlandSenegalSerbiaSingaporeSomaliaSouth AfricaSouth AmericaSouth Central AsiaSouth Eastern AsiaSouthern EuropeSpainSri LankaSudanSwedenSyriaTaiwanThailandTrinidad and TobagoTurkeyUgandaUkraineUzbekistanVenezuelaVietnamWestern AfricaWestern AsiaWestern EuropeYemenZaireZimbabwe
Immigrant Origin (Percentage)
AfghanistanAfricaAlbaniaArgentinaArmeniaAsiaAustraliaAustriaBangladeshBarbadosBelarusBelgiumBelizeBoliviaBosnia and HerzegovinaBrazilBulgariaBurma / MyanmarCambodiaCameroonCanadaCaribbeanCentral AmericaChileChinaColombiaCongoCosta RicaCroatiaCubaCzechoslovakiaDominican RepublicEastern AfricaEastern AsiaEastern EuropeEcuadorEgyptEl SalvadorEnglandEritreaEthiopiaEuropeFranceGermanyGhanaGreeceGrenadaGuatemalaGuyanaHaitiHondurasHong KongHungaryIndiaIranIraqIrelandIsraelItalyJamaicaJapanKazakhstanKenyaKoreaKuwaitLaosLatin AmericaLebanonLiberiaLithuaniaMalaysiaMexicoMiddle AfricaMoldovaMoroccoNepalNetherlandsNicaraguaNigeriaNorth MacedoniaNorthern AfricaNorthern EuropeOceaniaPakistanPanamaPeruPhilippinesPolandPortugalRomaniaRussiaSaudi ArabiaScotlandSenegalSerbiaSingaporeSomaliaSouth AfricaSouth AmericaSouth Central AsiaSouth Eastern AsiaSouthern EuropeSpainSri LankaSudanSwedenSyriaTaiwanThailandTrinidad and TobagoTurkeyUgandaUkraineUzbekistanVenezuelaVietnamWestern AfricaWestern AsiaWestern EuropeYemenZaireZimbabwe
Income
Income (Families)
Income (Households)
Poverty
Poverty (Families)
Unemployment
Employment Occupations
Employment Industries
Employer Class
Commute Time
Commute Means
School Enrollment
Education by Degree Field
Occupancy
Finances
Physical Characteristics
Rochester
Compare Zip Codes
Comparison Subject

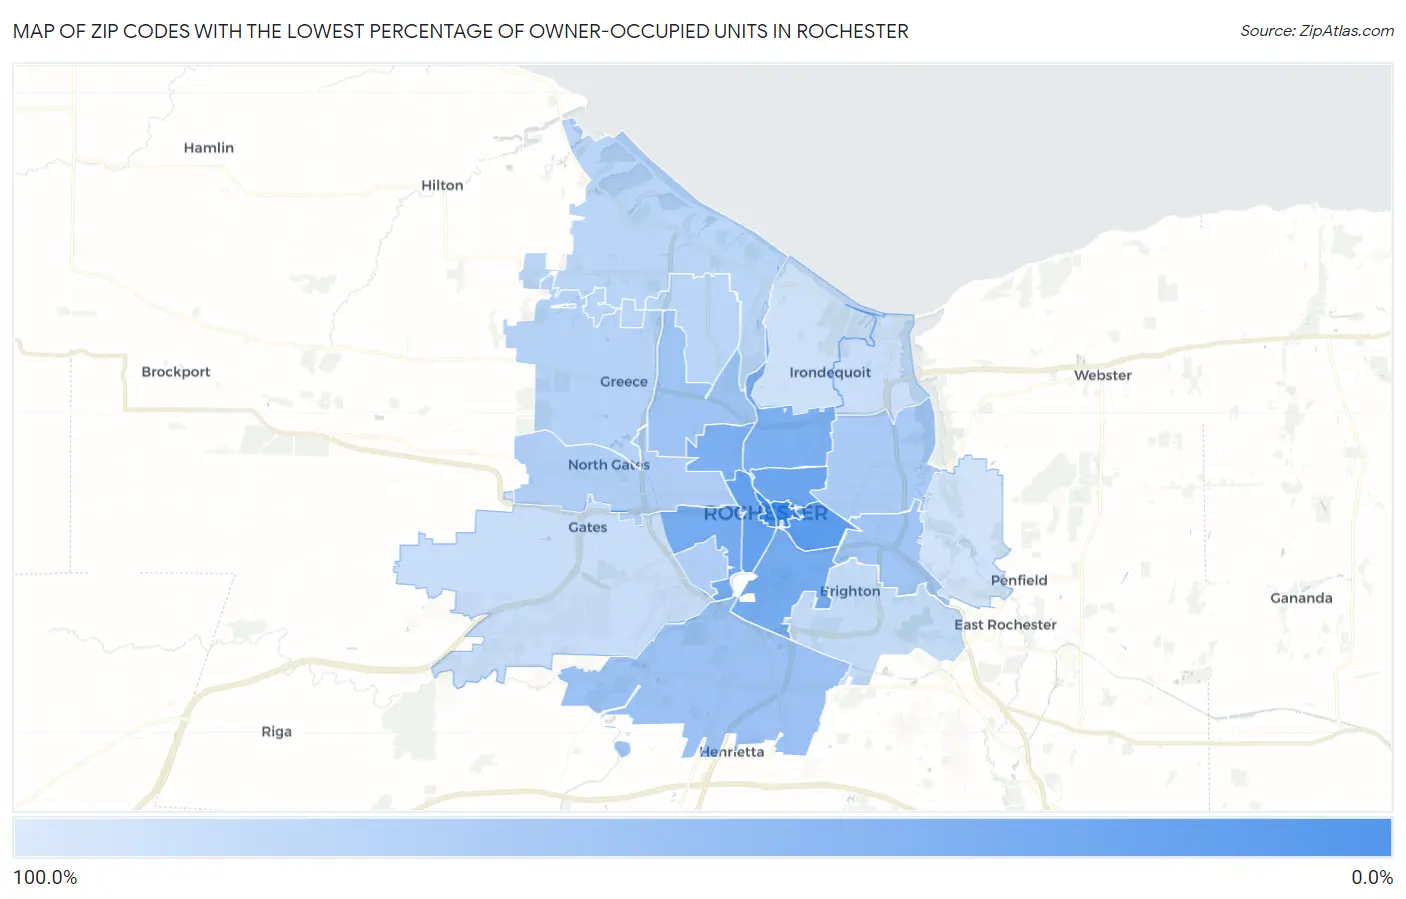
Map of Zip Codes with the Lowest Percentage of Owner-Occupied Units in Rochester

100.0%
0.0%
Zip Codes with the Lowest Percentage of Owner-Occupied Units in Rochester Map

Zip Codes with the Lowest Percentage of Owner-Occupied Units in Rochester, NY

Zip Code % Owner-Occupied vs State vs National
1.146043.8%54.3%(-50.4)#664.8%(-61.0)#73
2.146145.5%54.3%(-48.8)#964.8%(-59.3)#90
3.1460718.0%54.3%(-36.2)#5464.8%(-46.8)#324
4.1460821.8%54.3%(-32.4)#6664.8%(-43.0)#433
5.1460526.2%54.3%(-28.1)#7964.8%(-38.6)#578
6.1462030.1%54.3%(-24.1)#11064.8%(-34.7)#772
7.1461130.2%54.3%(-24.1)#11164.8%(-34.6)#777
8.1461333.6%54.3%(-20.6)#12564.8%(-31.2)#983
9.1462134.6%54.3%(-19.7)#13164.8%(-30.2)#1,058
10.1462351.2%54.3%(-3.13)#23564.8%(-13.7)#3,001
11.1461552.7%54.3%(-1.61)#24864.8%(-12.1)#3,283
12.1461054.2%54.3%(-0.118)#25964.8%(-10.6)#3,584
13.1460960.2%54.3%(+5.92)#33164.8%(-4.61)#5,176
14.1461963.5%54.3%(+9.26)#38264.8%(-1.27)#6,438
15.1460663.7%54.3%(+9.38)#38664.8%(-1.16)#6,492
16.1462667.9%54.3%(+13.6)#45564.8%(+3.08)#8,488
17.1461669.9%54.3%(+15.6)#49764.8%(+5.09)#9,704
18.1461270.2%54.3%(+15.9)#50764.8%(+5.34)#9,889
19.1461877.4%54.3%(+23.1)#77764.8%(+12.6)#15,490
20.1462479.7%54.3%(+25.4)#87264.8%(+14.9)#17,616
21.1462281.8%54.3%(+27.5)#98864.8%(+17.0)#19,653
22.1461784.2%54.3%(+30.0)#1,12364.8%(+19.4)#22,095
23.1462586.6%54.3%(+32.4)#1,23664.8%(+21.8)#24,330

Common Questions

What are the Top 10 Zip Codes with the Lowest Percentage of Owner-Occupied Units in Rochester, NY?
Top 10 Zip Codes with the Lowest Percentage of Owner-Occupied Units in Rochester, NY are:
#1
3.8%
#2
5.5%
#3
18.0%
#4
21.8%
#5
26.2%
#6
30.1%
#7
30.2%
#8
33.6%
#9
34.6%
#10
51.2%
What zip code has the Lowest Percentage of Owner-Occupied Units in Rochester, NY?
14604 has the Lowest Percentage of Owner-Occupied Units in Rochester, NY with 3.8%.
What is the Percentage of Owner-Occupied Units in Rochester, NY?
Percentage of Owner-Occupied Units in Rochester is 37.3%.
What is the Percentage of Owner-Occupied Units in New York?
Percentage of Owner-Occupied Units in New York is 54.3%.
What is the Percentage of Owner-Occupied Units in the United States?
Percentage of Owner-Occupied Units in the United States is 64.8%.