Zip Codes with the Highest Percentage of Population with a Degree in Psychology in Rochester, NY

RELATED REPORTS & OPTIONS

Psychology
Population
Families and Households
Female Fertility
Female Fertility (Unmarried)
Race (Community Size)
Race (Percentage)
Ancestry (Community Size)
AfghanAfricanAlbanianAlsatianAmericanApacheArabArgentineanArmenianAustralianAustrianBahamianBarbadianBasqueBelgianBelizeanBhutaneseBlackfeetBolivianBrazilianBritishBritish West IndianBulgarianBurmeseCambodianCanadianCape VerdeanCelticCentral AmericanCentral American IndianCherokeeChileanChippewaChoctawColombianCosta RicanCroatianCubanCzechCzechoslovakianDanishDominicanDutchEastern EuropeanEcuadorianEgyptianEnglishEstonianEthiopianEuropeanFilipinoFinnishFrenchFrench CanadianGermanGhanaianGreekGuamanian / ChamorroGuatemalanGuyaneseHaitianHonduranHungarianIcelanderIndian (Asian)IndonesianIranianIraqiIrishIroquoisIsraeliItalianJamaicanJapaneseKenyanKoreanLatvianLebaneseLiberianLithuanianLuxembourgerMacedonianMalaysianMexicanMexican American IndianMongolianMoroccanNative HawaiianNavajoNicaraguanNigerianNorthern EuropeanNorwegianPakistaniPalestinianPanamanianParaguayanPennsylvania GermanPeruvianPolishPortuguesePuebloPuerto RicanRomanianRussianSalvadoranSamoanScandinavianScotch-IrishScottishSeminoleSerbianSlavicSlovakSloveneSomaliSouth AfricanSouth AmericanSouth American IndianSpaniardSpanishSri LankanSubsaharan AfricanSudaneseSwedishSwissSyrianThaiTrinidadian and TobagonianTurkishU.S. Virgin IslanderUkrainianVenezuelanVietnameseWelshWest IndianYugoslavianZimbabwean
Ancestry (Percentage)
AfghanAfricanAlbanianAlsatianAmericanApacheArabArgentineanArmenianAustralianAustrianBahamianBarbadianBasqueBelgianBelizeanBhutaneseBlackfeetBolivianBrazilianBritishBritish West IndianBulgarianBurmeseCambodianCanadianCape VerdeanCelticCentral AmericanCentral American IndianCherokeeChileanChippewaChoctawColombianCosta RicanCroatianCubanCzechCzechoslovakianDanishDominicanDutchEastern EuropeanEcuadorianEgyptianEnglishEstonianEthiopianEuropeanFilipinoFinnishFrenchFrench CanadianGermanGhanaianGreekGuamanian / ChamorroGuatemalanGuyaneseHaitianHonduranHungarianIcelanderIndian (Asian)IndonesianIranianIraqiIrishIroquoisIsraeliItalianJamaicanJapaneseKenyanKoreanLatvianLebaneseLiberianLithuanianLuxembourgerMacedonianMalaysianMexicanMexican American IndianMongolianMoroccanNative HawaiianNavajoNicaraguanNigerianNorthern EuropeanNorwegianPakistaniPalestinianPanamanianParaguayanPennsylvania GermanPeruvianPolishPortuguesePuebloPuerto RicanRomanianRussianSalvadoranSamoanScandinavianScotch-IrishScottishSeminoleSerbianSlavicSlovakSloveneSomaliSouth AfricanSouth AmericanSouth American IndianSpaniardSpanishSri LankanSubsaharan AfricanSudaneseSwedishSwissSyrianThaiTrinidadian and TobagonianTurkishU.S. Virgin IslanderUkrainianVenezuelanVietnameseWelshWest IndianYugoslavianZimbabwean
Immigrant Origin (Total)
AfghanistanAfricaAlbaniaArgentinaArmeniaAsiaAustraliaAustriaBangladeshBarbadosBelarusBelgiumBelizeBoliviaBosnia and HerzegovinaBrazilBulgariaBurma / MyanmarCambodiaCameroonCanadaCaribbeanCentral AmericaChileChinaColombiaCongoCosta RicaCroatiaCubaCzechoslovakiaDominican RepublicEastern AfricaEastern AsiaEastern EuropeEcuadorEgyptEl SalvadorEnglandEritreaEthiopiaEuropeFranceGermanyGhanaGreeceGrenadaGuatemalaGuyanaHaitiHondurasHong KongHungaryIndiaIranIraqIrelandIsraelItalyJamaicaJapanKazakhstanKenyaKoreaKuwaitLaosLatin AmericaLebanonLiberiaLithuaniaMalaysiaMexicoMiddle AfricaMoldovaMoroccoNepalNetherlandsNicaraguaNigeriaNorth MacedoniaNorthern AfricaNorthern EuropeOceaniaPakistanPanamaPeruPhilippinesPolandPortugalRomaniaRussiaSaudi ArabiaScotlandSenegalSerbiaSingaporeSomaliaSouth AfricaSouth AmericaSouth Central AsiaSouth Eastern AsiaSouthern EuropeSpainSri LankaSudanSwedenSyriaTaiwanThailandTrinidad and TobagoTurkeyUgandaUkraineUzbekistanVenezuelaVietnamWestern AfricaWestern AsiaWestern EuropeYemenZaireZimbabwe
Immigrant Origin (Percentage)
AfghanistanAfricaAlbaniaArgentinaArmeniaAsiaAustraliaAustriaBangladeshBarbadosBelarusBelgiumBelizeBoliviaBosnia and HerzegovinaBrazilBulgariaBurma / MyanmarCambodiaCameroonCanadaCaribbeanCentral AmericaChileChinaColombiaCongoCosta RicaCroatiaCubaCzechoslovakiaDominican RepublicEastern AfricaEastern AsiaEastern EuropeEcuadorEgyptEl SalvadorEnglandEritreaEthiopiaEuropeFranceGermanyGhanaGreeceGrenadaGuatemalaGuyanaHaitiHondurasHong KongHungaryIndiaIranIraqIrelandIsraelItalyJamaicaJapanKazakhstanKenyaKoreaKuwaitLaosLatin AmericaLebanonLiberiaLithuaniaMalaysiaMexicoMiddle AfricaMoldovaMoroccoNepalNetherlandsNicaraguaNigeriaNorth MacedoniaNorthern AfricaNorthern EuropeOceaniaPakistanPanamaPeruPhilippinesPolandPortugalRomaniaRussiaSaudi ArabiaScotlandSenegalSerbiaSingaporeSomaliaSouth AfricaSouth AmericaSouth Central AsiaSouth Eastern AsiaSouthern EuropeSpainSri LankaSudanSwedenSyriaTaiwanThailandTrinidad and TobagoTurkeyUgandaUkraineUzbekistanVenezuelaVietnamWestern AfricaWestern AsiaWestern EuropeYemenZaireZimbabwe
Income
Income (Families)
Income (Households)
Poverty
Poverty (Families)
Unemployment
Employment Occupations
Employment Industries
Employer Class
Commute Time
Commute Means
School Enrollment
Education by Degree Field
Occupancy
Finances
Physical Characteristics
Rochester
Compare Zip Codes
Comparison Subject

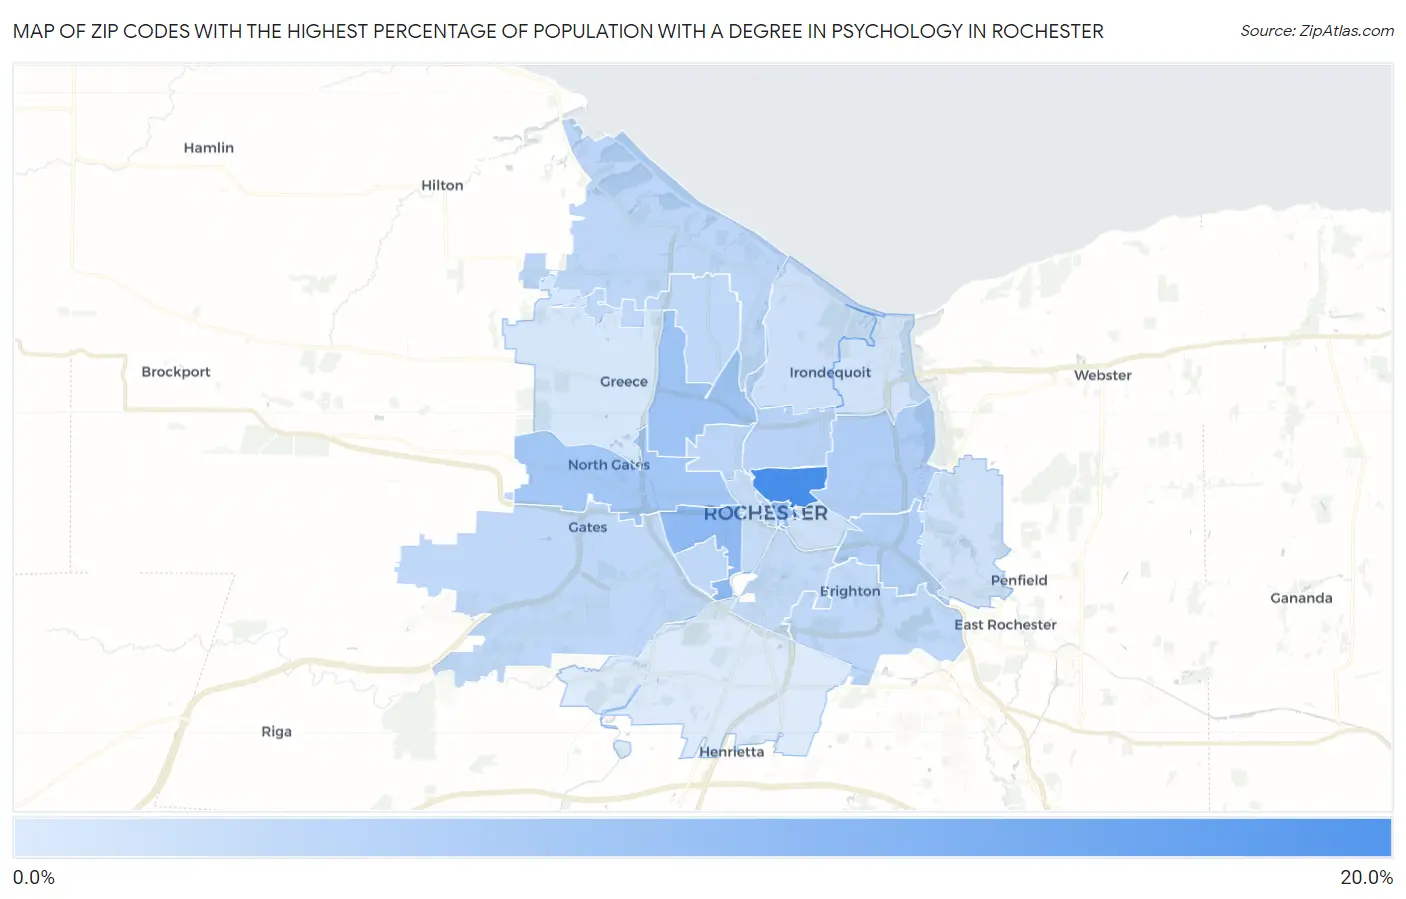
Map of Zip Codes with the Highest Percentage of Population with a Degree in Psychology in Rochester

0.0%
20.0%
Zip Codes with the Highest Percentage of Population with a Degree in Psychology in Rochester Map

Zip Codes with the Highest Percentage of Population with a Degree in Psychology in Rochester, NY

Zip Code % Graduates vs State vs National
1.1460517.7%5.9%(+11.8)#665.1%(+12.6)#833
2.1461110.7%5.9%(+4.81)#1685.1%(+5.63)#2,184
3.146049.8%5.9%(+3.98)#2065.1%(+4.79)#2,580
4.146159.3%5.9%(+3.42)#2445.1%(+4.24)#2,917
5.146068.8%5.9%(+2.97)#2745.1%(+3.78)#3,280
6.146097.7%5.9%(+1.85)#3755.1%(+2.67)#4,463
7.146107.6%5.9%(+1.71)#3945.1%(+2.53)#4,681
8.146216.9%5.9%(+1.06)#4885.1%(+1.87)#5,770
9.146136.5%5.9%(+0.589)#5785.1%(+1.41)#6,744
10.146126.4%5.9%(+0.568)#5885.1%(+1.39)#6,806
11.146166.3%5.9%(+0.475)#6075.1%(+1.29)#7,030
12.146196.3%5.9%(+0.446)#6145.1%(+1.26)#7,102
13.146186.3%5.9%(+0.435)#6185.1%(+1.25)#7,127
14.146246.3%5.9%(+0.415)#6205.1%(+1.23)#7,174
15.146146.2%5.9%(+0.381)#6295.1%(+1.20)#7,250
16.146206.0%5.9%(+0.111)#6935.1%(+0.929)#7,996
17.146085.6%5.9%(-0.259)#7755.1%(+0.558)#9,156
18.146175.1%5.9%(-0.778)#9025.1%(+0.040)#10,937
19.146075.0%5.9%(-0.916)#9255.1%(-0.099)#11,447
20.146254.9%5.9%(-0.946)#9305.1%(-0.128)#11,545
21.146224.7%5.9%(-1.21)#9785.1%(-0.397)#12,496
22.146264.3%5.9%(-1.58)#1,0585.1%(-0.766)#13,912
23.146233.6%5.9%(-2.26)#1,1605.1%(-1.44)#16,292

Common Questions

What are the Top 10 Zip Codes with the Highest Percentage of Population with a Degree in Psychology in Rochester, NY?
Top 10 Zip Codes with the Highest Percentage of Population with a Degree in Psychology in Rochester, NY are:
#1
17.7%
#2
10.7%
#3
9.8%
#4
9.3%
#5
8.8%
#6
7.7%
#7
7.6%
#8
6.9%
#9
6.5%
#10
6.4%
What zip code has the Highest Percentage of Population with a Degree in Psychology in Rochester, NY?
14605 has the Highest Percentage of Population with a Degree in Psychology in Rochester, NY with 17.7%.
What is the Percentage of Population with a Degree in Psychology in Rochester, NY?
Percentage of Population with a Degree in Psychology in Rochester is 7.0%.
What is the Percentage of Population with a Degree in Psychology in New York?
Percentage of Population with a Degree in Psychology in New York is 5.9%.
What is the Percentage of Population with a Degree in Psychology in the United States?
Percentage of Population with a Degree in Psychology in the United States is 5.1%.