Zip Codes with the Highest Female Poverty Level in Rochester, NY

RELATED REPORTS & OPTIONS

Highest Poverty | Female
Population
Families and Households
Female Fertility
Female Fertility (Unmarried)
Race (Community Size)
Race (Percentage)
Ancestry (Community Size)
AfghanAfricanAlbanianAlsatianAmericanApacheArabArgentineanArmenianAustralianAustrianBahamianBarbadianBasqueBelgianBelizeanBhutaneseBlackfeetBolivianBrazilianBritishBritish West IndianBulgarianBurmeseCambodianCanadianCape VerdeanCelticCentral AmericanCentral American IndianCherokeeChileanChippewaChoctawColombianCosta RicanCroatianCubanCzechCzechoslovakianDanishDominicanDutchEastern EuropeanEcuadorianEgyptianEnglishEstonianEthiopianEuropeanFilipinoFinnishFrenchFrench CanadianGermanGhanaianGreekGuamanian / ChamorroGuatemalanGuyaneseHaitianHonduranHungarianIcelanderIndian (Asian)IndonesianIranianIraqiIrishIroquoisIsraeliItalianJamaicanJapaneseKenyanKoreanLatvianLebaneseLiberianLithuanianLuxembourgerMacedonianMalaysianMexicanMexican American IndianMongolianMoroccanNative HawaiianNavajoNicaraguanNigerianNorthern EuropeanNorwegianPakistaniPalestinianPanamanianParaguayanPennsylvania GermanPeruvianPolishPortuguesePuebloPuerto RicanRomanianRussianSalvadoranSamoanScandinavianScotch-IrishScottishSeminoleSerbianSlavicSlovakSloveneSomaliSouth AfricanSouth AmericanSouth American IndianSpaniardSpanishSri LankanSubsaharan AfricanSudaneseSwedishSwissSyrianThaiTrinidadian and TobagonianTurkishU.S. Virgin IslanderUkrainianVenezuelanVietnameseWelshWest IndianYugoslavianZimbabwean
Ancestry (Percentage)
AfghanAfricanAlbanianAlsatianAmericanApacheArabArgentineanArmenianAustralianAustrianBahamianBarbadianBasqueBelgianBelizeanBhutaneseBlackfeetBolivianBrazilianBritishBritish West IndianBulgarianBurmeseCambodianCanadianCape VerdeanCelticCentral AmericanCentral American IndianCherokeeChileanChippewaChoctawColombianCosta RicanCroatianCubanCzechCzechoslovakianDanishDominicanDutchEastern EuropeanEcuadorianEgyptianEnglishEstonianEthiopianEuropeanFilipinoFinnishFrenchFrench CanadianGermanGhanaianGreekGuamanian / ChamorroGuatemalanGuyaneseHaitianHonduranHungarianIcelanderIndian (Asian)IndonesianIranianIraqiIrishIroquoisIsraeliItalianJamaicanJapaneseKenyanKoreanLatvianLebaneseLiberianLithuanianLuxembourgerMacedonianMalaysianMexicanMexican American IndianMongolianMoroccanNative HawaiianNavajoNicaraguanNigerianNorthern EuropeanNorwegianPakistaniPalestinianPanamanianParaguayanPennsylvania GermanPeruvianPolishPortuguesePuebloPuerto RicanRomanianRussianSalvadoranSamoanScandinavianScotch-IrishScottishSeminoleSerbianSlavicSlovakSloveneSomaliSouth AfricanSouth AmericanSouth American IndianSpaniardSpanishSri LankanSubsaharan AfricanSudaneseSwedishSwissSyrianThaiTrinidadian and TobagonianTurkishU.S. Virgin IslanderUkrainianVenezuelanVietnameseWelshWest IndianYugoslavianZimbabwean
Immigrant Origin (Total)
AfghanistanAfricaAlbaniaArgentinaArmeniaAsiaAustraliaAustriaBangladeshBarbadosBelarusBelgiumBelizeBoliviaBosnia and HerzegovinaBrazilBulgariaBurma / MyanmarCambodiaCameroonCanadaCaribbeanCentral AmericaChileChinaColombiaCongoCosta RicaCroatiaCubaCzechoslovakiaDominican RepublicEastern AfricaEastern AsiaEastern EuropeEcuadorEgyptEl SalvadorEnglandEritreaEthiopiaEuropeFranceGermanyGhanaGreeceGrenadaGuatemalaGuyanaHaitiHondurasHong KongHungaryIndiaIranIraqIrelandIsraelItalyJamaicaJapanKazakhstanKenyaKoreaKuwaitLaosLatin AmericaLebanonLiberiaLithuaniaMalaysiaMexicoMiddle AfricaMoldovaMoroccoNepalNetherlandsNicaraguaNigeriaNorth MacedoniaNorthern AfricaNorthern EuropeOceaniaPakistanPanamaPeruPhilippinesPolandPortugalRomaniaRussiaSaudi ArabiaScotlandSenegalSerbiaSingaporeSomaliaSouth AfricaSouth AmericaSouth Central AsiaSouth Eastern AsiaSouthern EuropeSpainSri LankaSudanSwedenSyriaTaiwanThailandTrinidad and TobagoTurkeyUgandaUkraineUzbekistanVenezuelaVietnamWestern AfricaWestern AsiaWestern EuropeYemenZaireZimbabwe
Immigrant Origin (Percentage)
AfghanistanAfricaAlbaniaArgentinaArmeniaAsiaAustraliaAustriaBangladeshBarbadosBelarusBelgiumBelizeBoliviaBosnia and HerzegovinaBrazilBulgariaBurma / MyanmarCambodiaCameroonCanadaCaribbeanCentral AmericaChileChinaColombiaCongoCosta RicaCroatiaCubaCzechoslovakiaDominican RepublicEastern AfricaEastern AsiaEastern EuropeEcuadorEgyptEl SalvadorEnglandEritreaEthiopiaEuropeFranceGermanyGhanaGreeceGrenadaGuatemalaGuyanaHaitiHondurasHong KongHungaryIndiaIranIraqIrelandIsraelItalyJamaicaJapanKazakhstanKenyaKoreaKuwaitLaosLatin AmericaLebanonLiberiaLithuaniaMalaysiaMexicoMiddle AfricaMoldovaMoroccoNepalNetherlandsNicaraguaNigeriaNorth MacedoniaNorthern AfricaNorthern EuropeOceaniaPakistanPanamaPeruPhilippinesPolandPortugalRomaniaRussiaSaudi ArabiaScotlandSenegalSerbiaSingaporeSomaliaSouth AfricaSouth AmericaSouth Central AsiaSouth Eastern AsiaSouthern EuropeSpainSri LankaSudanSwedenSyriaTaiwanThailandTrinidad and TobagoTurkeyUgandaUkraineUzbekistanVenezuelaVietnamWestern AfricaWestern AsiaWestern EuropeYemenZaireZimbabwe
Income
Income (Families)
Income (Households)
Poverty
Poverty (Families)
Unemployment
Employment Occupations
Employment Industries
Employer Class
Commute Time
Commute Means
School Enrollment
Education by Degree Field
Occupancy
Finances
Physical Characteristics
Rochester
Compare Zip Codes
Comparison Subject

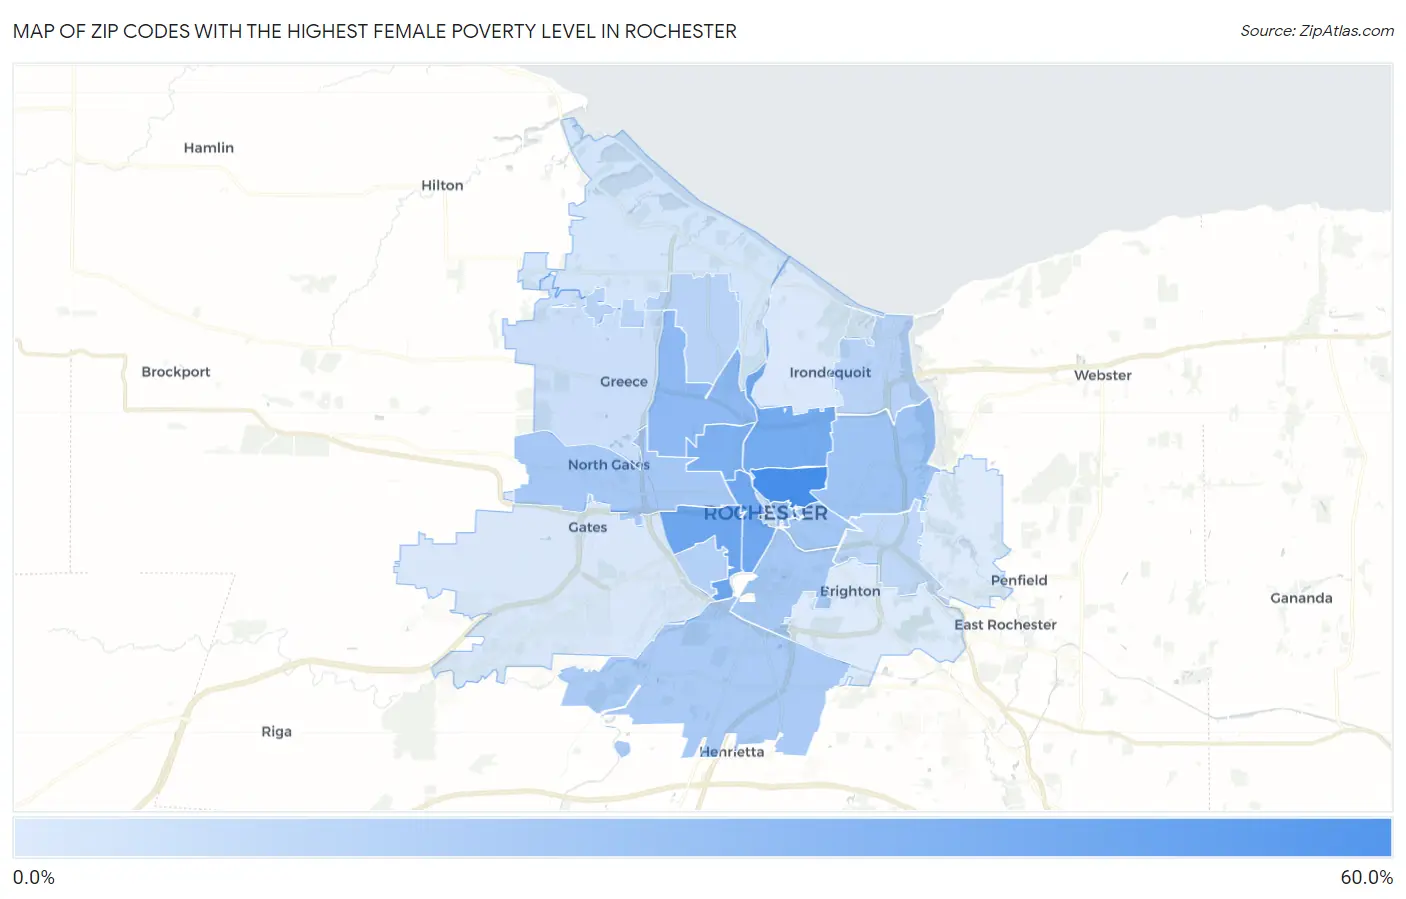
Map of Zip Codes with the Highest Female Poverty Level in Rochester

0.0%
60.0%
Zip Codes with the Highest Female Poverty Level in Rochester Map

Zip Codes with the Highest Female Poverty Level in Rochester, NY

Zip Code Female Poverty vs State vs National
1.1460550.6%14.7%(+35.9)#2413.7%(+36.9)#631
2.1461137.1%14.7%(+22.3)#5513.7%(+23.4)#1,529
3.1460836.4%14.7%(+21.6)#6113.7%(+22.7)#1,614
4.1462135.1%14.7%(+20.4)#6713.7%(+21.4)#1,802
5.1461332.2%14.7%(+17.5)#8713.7%(+18.5)#2,310
6.1461527.6%14.7%(+12.8)#12713.7%(+13.9)#3,506
7.1460424.8%14.7%(+10.1)#16213.7%(+11.1)#4,547
8.1460922.4%14.7%(+7.72)#21213.7%(+8.74)#5,701
9.1460721.1%14.7%(+6.34)#25413.7%(+7.36)#6,545
10.1460620.4%14.7%(+5.72)#26813.7%(+6.74)#6,964
11.1462020.3%14.7%(+5.54)#27413.7%(+6.56)#7,086
12.1462319.1%14.7%(+4.41)#32613.7%(+5.44)#7,893
13.1461916.8%14.7%(+2.12)#42313.7%(+3.14)#9,903
14.1462215.7%14.7%(+0.973)#48513.7%(+2.00)#11,102
15.1461615.5%14.7%(+0.752)#50013.7%(+1.77)#11,330
16.1461013.6%14.7%(-1.14)#61113.7%(-0.120)#13,566
17.1461411.3%14.7%(-3.43)#78513.7%(-2.41)#16,685
18.1462610.5%14.7%(-4.20)#83513.7%(-3.17)#17,790
19.146128.2%14.7%(-6.48)#1,03813.7%(-5.46)#21,399
20.146247.0%14.7%(-7.77)#1,15113.7%(-6.74)#23,441
21.146176.4%14.7%(-8.35)#1,18913.7%(-7.33)#24,389
22.146256.0%14.7%(-8.71)#1,22213.7%(-7.69)#24,954
23.146185.9%14.7%(-8.86)#1,24413.7%(-7.83)#25,180

Common Questions

What are the Top 10 Zip Codes with the Highest Female Poverty Level in Rochester, NY?
Top 10 Zip Codes with the Highest Female Poverty Level in Rochester, NY are:
#1
50.6%
#2
37.1%
#3
36.4%
#4
35.1%
#5
32.2%
#6
27.6%
#7
24.8%
#8
22.4%
#9
21.1%
#10
20.4%
What zip code has the Highest Female Poverty Level in Rochester, NY?
14605 has the Highest Female Poverty Level in Rochester, NY with 50.6%.
What is the Poverty Level Among Females in Rochester, NY?
Poverty Level Among Females in Rochester is 29.5%.
What is the Poverty Level Among Females in New York?
Poverty Level Among Females in New York is 14.7%.
What is the Poverty Level Among Females in the United States?
Poverty Level Among Females in the United States is 13.7%.