Zip Codes with the Highest Percentage of Population with a Degree in Literature and Languages in New Hampshire
RELATED REPORTS & OPTIONS
Literature and Languages
New Hampshire
Compare Zip Codes
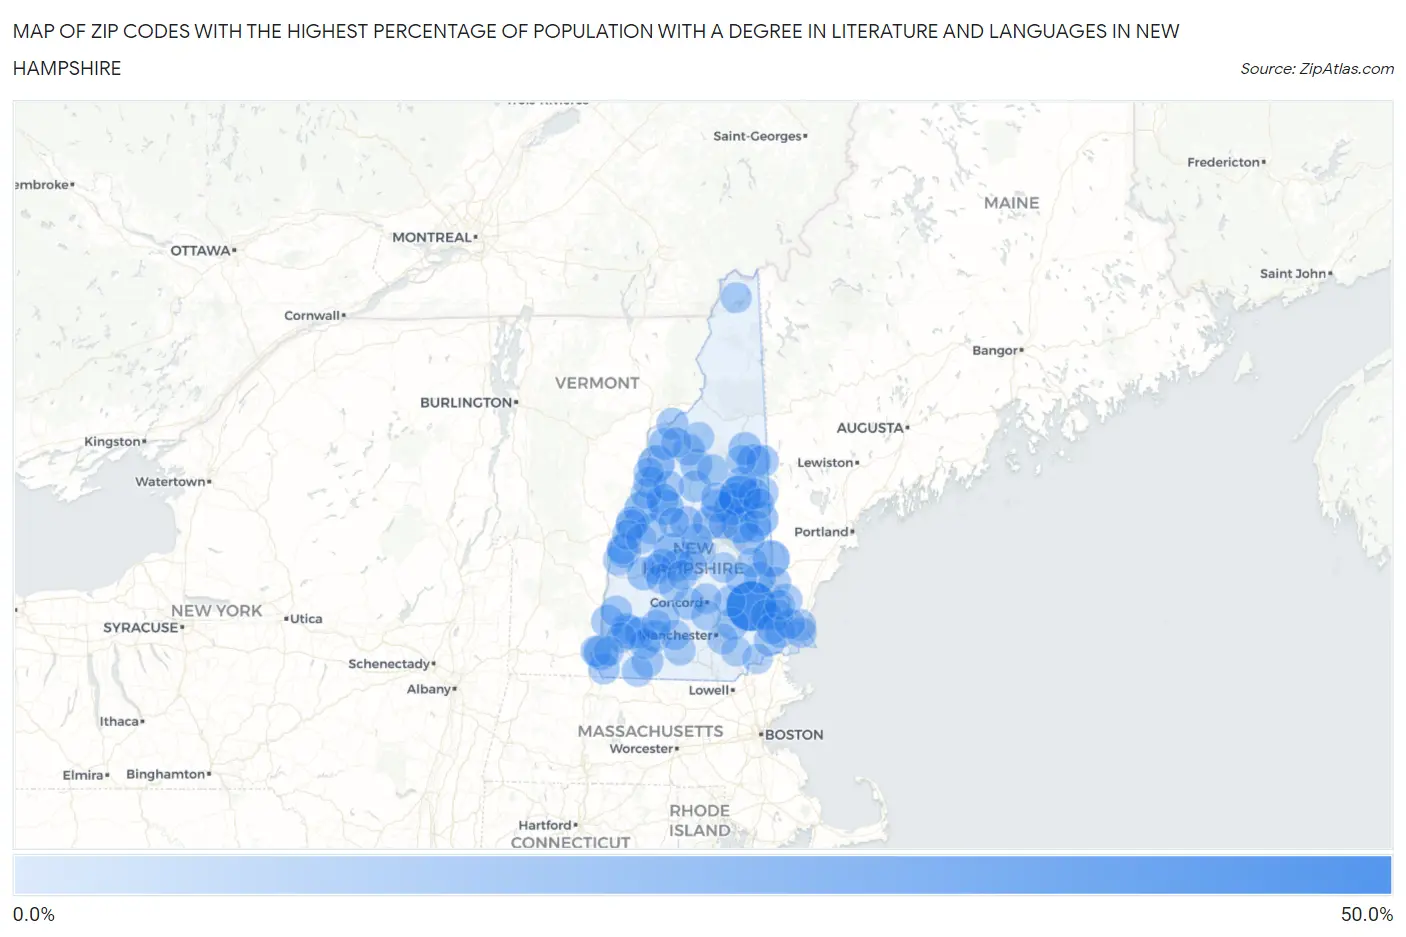
Map of Zip Codes with the Highest Percentage of Population with a Degree in Literature and Languages in New Hampshire
0.0%
50.0%
Zip Codes with the Highest Percentage of Population with a Degree in Literature and Languages in New Hampshire
| Zip Code | % Graduates | vs State | vs National | |
| 1. | 03291 | 50.0% | 5.5%(+44.5)#1 | 4.4%(+45.6)#68 |
| 2. | 03817 | 32.2% | 5.5%(+26.7)#2 | 4.4%(+27.8)#182 |
| 3. | 03852 | 21.0% | 5.5%(+15.5)#3 | 4.4%(+16.6)#436 |
| 4. | 03774 | 20.5% | 5.5%(+15.0)#4 | 4.4%(+16.1)#455 |
| 5. | 03816 | 20.0% | 5.5%(+14.5)#5 | 4.4%(+15.5)#484 |
| 6. | 03230 | 18.8% | 5.5%(+13.3)#6 | 4.4%(+14.3)#536 |
| 7. | 03883 | 18.6% | 5.5%(+13.1)#7 | 4.4%(+14.2)#543 |
| 8. | 03266 | 16.4% | 5.5%(+10.9)#8 | 4.4%(+12.0)#680 |
| 9. | 03443 | 16.3% | 5.5%(+10.9)#9 | 4.4%(+11.9)#687 |
| 10. | 03882 | 14.5% | 5.5%(+9.02)#10 | 4.4%(+10.1)#872 |
| 11. | 03768 | 14.3% | 5.5%(+8.81)#11 | 4.4%(+9.88)#890 |
| 12. | 03445 | 14.2% | 5.5%(+8.72)#12 | 4.4%(+9.79)#905 |
| 13. | 03845 | 13.8% | 5.5%(+8.35)#13 | 4.4%(+9.42)#942 |
| 14. | 03226 | 13.5% | 5.5%(+8.01)#14 | 4.4%(+9.07)#982 |
| 15. | 03770 | 12.4% | 5.5%(+6.96)#15 | 4.4%(+8.03)#1,153 |
| 16. | 03846 | 12.4% | 5.5%(+6.91)#16 | 4.4%(+7.97)#1,157 |
| 17. | 03227 | 12.3% | 5.5%(+6.84)#17 | 4.4%(+7.90)#1,167 |
| 18. | 03782 | 12.1% | 5.5%(+6.59)#18 | 4.4%(+7.65)#1,210 |
| 19. | 03755 | 12.0% | 5.5%(+6.48)#19 | 4.4%(+7.54)#1,230 |
| 20. | 03264 | 11.7% | 5.5%(+6.18)#20 | 4.4%(+7.25)#1,298 |
| 21. | 03608 | 11.4% | 5.5%(+5.96)#21 | 4.4%(+7.03)#1,344 |
| 22. | 03779 | 11.3% | 5.5%(+5.84)#22 | 4.4%(+6.90)#1,387 |
| 23. | 03282 | 11.1% | 5.5%(+5.68)#23 | 4.4%(+6.74)#1,417 |
| 24. | 03585 | 11.1% | 5.5%(+5.64)#24 | 4.4%(+6.70)#1,423 |
| 25. | 03886 | 11.1% | 5.5%(+5.58)#25 | 4.4%(+6.64)#1,458 |
| 26. | 03216 | 11.0% | 5.5%(+5.53)#26 | 4.4%(+6.59)#1,470 |
| 27. | 03813 | 10.9% | 5.5%(+5.39)#27 | 4.4%(+6.46)#1,512 |
| 28. | 03869 | 10.5% | 5.5%(+5.05)#28 | 4.4%(+6.11)#1,633 |
| 29. | 03034 | 10.5% | 5.5%(+5.02)#29 | 4.4%(+6.09)#1,639 |
| 30. | 03251 | 10.3% | 5.5%(+4.82)#30 | 4.4%(+5.89)#1,714 |
| 31. | 03833 | 10.1% | 5.5%(+4.64)#31 | 4.4%(+5.71)#1,774 |
| 32. | 03854 | 10.0% | 5.5%(+4.53)#32 | 4.4%(+5.59)#1,822 |
| 33. | 03864 | 10.0% | 5.5%(+4.50)#33 | 4.4%(+5.56)#1,845 |
| 34. | 03868 | 10.0% | 5.5%(+4.48)#34 | 4.4%(+5.55)#1,851 |
| 35. | 03229 | 9.9% | 5.5%(+4.39)#35 | 4.4%(+5.46)#1,884 |
| 36. | 03832 | 9.8% | 5.5%(+4.35)#36 | 4.4%(+5.42)#1,905 |
| 37. | 03894 | 9.8% | 5.5%(+4.32)#37 | 4.4%(+5.39)#1,917 |
| 38. | 03580 | 9.8% | 5.5%(+4.31)#38 | 4.4%(+5.37)#1,922 |
| 39. | 03561 | 9.5% | 5.5%(+4.02)#39 | 4.4%(+5.08)#2,049 |
| 40. | 03285 | 9.4% | 5.5%(+3.94)#40 | 4.4%(+5.01)#2,077 |
| 41. | 03452 | 9.3% | 5.5%(+3.86)#41 | 4.4%(+4.92)#2,135 |
| 42. | 03449 | 9.3% | 5.5%(+3.85)#42 | 4.4%(+4.92)#2,136 |
| 43. | 03849 | 9.1% | 5.5%(+3.62)#43 | 4.4%(+4.68)#2,267 |
| 44. | 03835 | 8.9% | 5.5%(+3.44)#44 | 4.4%(+4.50)#2,367 |
| 45. | 03818 | 8.9% | 5.5%(+3.42)#45 | 4.4%(+4.49)#2,378 |
| 46. | 03448 | 8.7% | 5.5%(+3.26)#46 | 4.4%(+4.32)#2,455 |
| 47. | 03602 | 8.6% | 5.5%(+3.11)#47 | 4.4%(+4.18)#2,551 |
| 48. | 03269 | 8.6% | 5.5%(+3.10)#48 | 4.4%(+4.16)#2,562 |
| 49. | 03457 | 8.6% | 5.5%(+3.08)#49 | 4.4%(+4.14)#2,575 |
| 50. | 03244 | 8.5% | 5.5%(+3.01)#50 | 4.4%(+4.07)#2,627 |
| 51. | 03234 | 8.3% | 5.5%(+2.81)#51 | 4.4%(+3.88)#2,758 |
| 52. | 03215 | 8.2% | 5.5%(+2.75)#52 | 4.4%(+3.81)#2,805 |
| 53. | 03225 | 8.2% | 5.5%(+2.73)#53 | 4.4%(+3.79)#2,815 |
| 54. | 03824 | 8.2% | 5.5%(+2.73)#54 | 4.4%(+3.79)#2,818 |
| 55. | 03441 | 8.2% | 5.5%(+2.72)#55 | 4.4%(+3.79)#2,821 |
| 56. | 03745 | 8.1% | 5.5%(+2.65)#56 | 4.4%(+3.71)#2,887 |
| 57. | 03447 | 8.1% | 5.5%(+2.63)#57 | 4.4%(+3.69)#2,903 |
| 58. | 03450 | 8.1% | 5.5%(+2.61)#58 | 4.4%(+3.68)#2,912 |
| 59. | 03741 | 8.1% | 5.5%(+2.59)#59 | 4.4%(+3.65)#2,932 |
| 60. | 03836 | 8.0% | 5.5%(+2.52)#60 | 4.4%(+3.58)#2,992 |
| 61. | 03466 | 8.0% | 5.5%(+2.50)#61 | 4.4%(+3.56)#3,006 |
| 62. | 03777 | 8.0% | 5.5%(+2.48)#62 | 4.4%(+3.54)#3,020 |
| 63. | 03861 | 7.9% | 5.5%(+2.43)#63 | 4.4%(+3.49)#3,061 |
| 64. | 03082 | 7.8% | 5.5%(+2.35)#64 | 4.4%(+3.41)#3,136 |
| 65. | 03781 | 7.8% | 5.5%(+2.32)#65 | 4.4%(+3.39)#3,160 |
| 66. | 03279 | 7.8% | 5.5%(+2.32)#66 | 4.4%(+3.38)#3,166 |
| 67. | 03885 | 7.7% | 5.5%(+2.23)#67 | 4.4%(+3.30)#3,242 |
| 68. | 03750 | 7.7% | 5.5%(+2.18)#68 | 4.4%(+3.24)#3,304 |
| 69. | 03856 | 7.6% | 5.5%(+2.16)#69 | 4.4%(+3.22)#3,321 |
| 70. | 03109 | 7.3% | 5.5%(+1.86)#70 | 4.4%(+2.93)#3,623 |
| 71. | 03256 | 7.3% | 5.5%(+1.86)#71 | 4.4%(+2.92)#3,626 |
| 72. | 03592 | 7.2% | 5.5%(+1.77)#72 | 4.4%(+2.84)#3,713 |
| 73. | 03574 | 7.2% | 5.5%(+1.75)#73 | 4.4%(+2.81)#3,734 |
| 74. | 03870 | 7.1% | 5.5%(+1.65)#74 | 4.4%(+2.71)#3,843 |
| 75. | 03586 | 7.1% | 5.5%(+1.60)#75 | 4.4%(+2.67)#3,910 |
| 76. | 03287 | 6.9% | 5.5%(+1.44)#76 | 4.4%(+2.50)#4,096 |
| 77. | 03801 | 6.9% | 5.5%(+1.41)#77 | 4.4%(+2.48)#4,124 |
| 78. | 03766 | 6.9% | 5.5%(+1.38)#78 | 4.4%(+2.45)#4,172 |
| 79. | 03043 | 6.8% | 5.5%(+1.29)#79 | 4.4%(+2.35)#4,288 |
| 80. | 03301 | 6.7% | 5.5%(+1.20)#80 | 4.4%(+2.26)#4,389 |
| 81. | 03241 | 6.6% | 5.5%(+1.16)#81 | 4.4%(+2.23)#4,451 |
| 82. | 03235 | 6.6% | 5.5%(+1.11)#82 | 4.4%(+2.17)#4,526 |
| 83. | 03257 | 6.6% | 5.5%(+1.09)#83 | 4.4%(+2.16)#4,544 |
| 84. | 03254 | 6.5% | 5.5%(+1.04)#84 | 4.4%(+2.11)#4,616 |
| 85. | 03259 | 6.5% | 5.5%(+1.00)#85 | 4.4%(+2.07)#4,681 |
| 86. | 03748 | 6.4% | 5.5%(+0.944)#86 | 4.4%(+2.01)#4,772 |
| 87. | 03260 | 6.4% | 5.5%(+0.932)#87 | 4.4%(+2.00)#4,789 |
| 88. | 03038 | 6.3% | 5.5%(+0.864)#88 | 4.4%(+1.93)#4,880 |
| 89. | 03865 | 6.3% | 5.5%(+0.844)#89 | 4.4%(+1.91)#4,905 |
| 90. | 03440 | 6.3% | 5.5%(+0.821)#90 | 4.4%(+1.88)#4,941 |
| 91. | 03278 | 6.3% | 5.5%(+0.812)#91 | 4.4%(+1.88)#4,950 |
| 92. | 03820 | 6.2% | 5.5%(+0.758)#92 | 4.4%(+1.82)#5,044 |
| 93. | 03237 | 6.2% | 5.5%(+0.747)#93 | 4.4%(+1.81)#5,064 |
| 94. | 03304 | 6.2% | 5.5%(+0.731)#94 | 4.4%(+1.79)#5,082 |
| 95. | 03855 | 6.1% | 5.5%(+0.649)#95 | 4.4%(+1.71)#5,226 |
| 96. | 03268 | 6.1% | 5.5%(+0.609)#96 | 4.4%(+1.67)#5,295 |
| 97. | 03431 | 6.1% | 5.5%(+0.606)#97 | 4.4%(+1.67)#5,303 |
| 98. | 03462 | 6.0% | 5.5%(+0.491)#98 | 4.4%(+1.55)#5,476 |
| 99. | 03765 | 5.9% | 5.5%(+0.448)#99 | 4.4%(+1.51)#5,564 |
| 100. | 03838 | 5.9% | 5.5%(+0.426)#100 | 4.4%(+1.49)#5,595 |
Common Questions
What are the Top 10 Zip Codes with the Highest Percentage of Population with a Degree in Literature and Languages in New Hampshire?
Top 10 Zip Codes with the Highest Percentage of Population with a Degree in Literature and Languages in New Hampshire are:
What zip code has the Highest Percentage of Population with a Degree in Literature and Languages in New Hampshire?
03291 has the Highest Percentage of Population with a Degree in Literature and Languages in New Hampshire with 50.0%.
What is the Percentage of Population with a Degree in Literature and Languages in the State of New Hampshire?
Percentage of Population with a Degree in Literature and Languages in New Hampshire is 5.5%.
What is the Percentage of Population with a Degree in Literature and Languages in the United States?
Percentage of Population with a Degree in Literature and Languages in the United States is 4.4%.