Zip Codes with the Highest Percentage of Households Residing in Condos/Apartments in New Hampshire
RELATED REPORTS & OPTIONS
Condo/Apartment Residency
New Hampshire
Compare Zip Codes
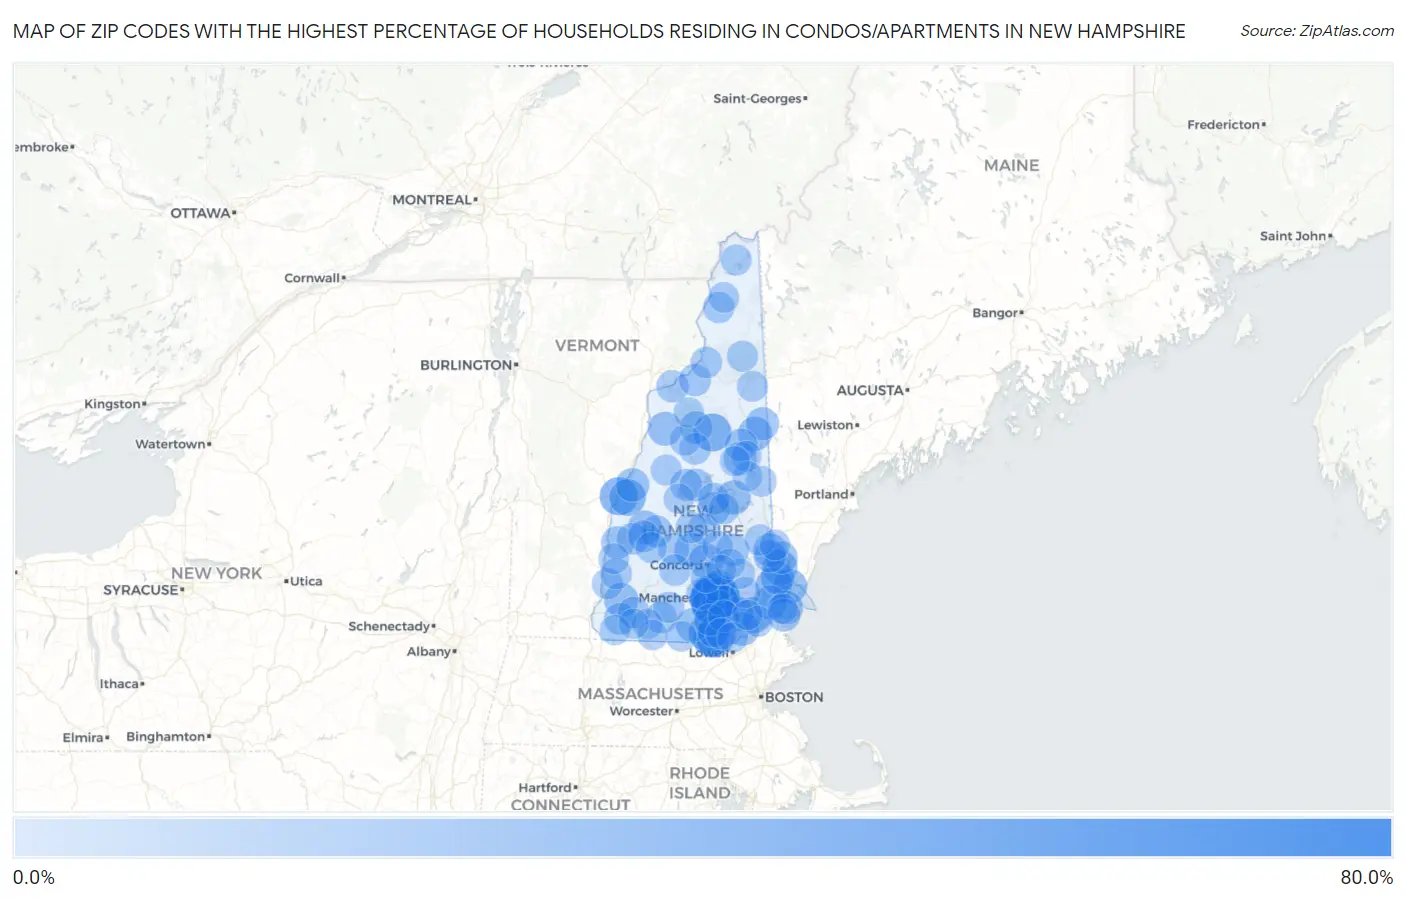
Map of Zip Codes with the Highest Percentage of Households Residing in Condos/Apartments in New Hampshire
0.0%
80.0%
Zip Codes with the Highest Percentage of Households Residing in Condos/Apartments in New Hampshire
| Zip Code | Detached Home Residency | vs State | vs National | |
| 1. | 03101 | 75.1% | 10.9%(+64.2)#1 | 13.8%(+61.3)#288 |
| 2. | 03102 | 34.6% | 10.9%(+23.7)#2 | 13.8%(+20.8)#1,024 |
| 3. | 03215 | 31.0% | 10.9%(+20.1)#3 | 13.8%(+17.2)#1,234 |
| 4. | 03784 | 30.8% | 10.9%(+19.9)#4 | 13.8%(+17.0)#1,244 |
| 5. | 03063 | 30.2% | 10.9%(+19.3)#5 | 13.8%(+16.4)#1,279 |
| 6. | 03060 | 27.7% | 10.9%(+16.8)#6 | 13.8%(+13.9)#1,469 |
| 7. | 03062 | 27.4% | 10.9%(+16.5)#7 | 13.8%(+13.6)#1,491 |
| 8. | 03857 | 26.2% | 10.9%(+15.3)#8 | 13.8%(+12.4)#1,618 |
| 9. | 03766 | 25.5% | 10.9%(+14.6)#9 | 13.8%(+11.7)#1,683 |
| 10. | 03826 | 23.0% | 10.9%(+12.1)#10 | 13.8%(+9.20)#1,981 |
| 11. | 03104 | 21.7% | 10.9%(+10.8)#11 | 13.8%(+7.90)#2,139 |
| 12. | 03038 | 20.6% | 10.9%(+9.70)#12 | 13.8%(+6.80)#2,315 |
| 13. | 03301 | 20.3% | 10.9%(+9.40)#13 | 13.8%(+6.50)#2,368 |
| 14. | 03820 | 19.9% | 10.9%(+9.00)#14 | 13.8%(+6.10)#2,441 |
| 15. | 03801 | 17.9% | 10.9%(+7.00)#15 | 13.8%(+4.10)#2,851 |
| 16. | 03431 | 17.1% | 10.9%(+6.20)#16 | 13.8%(+3.30)#3,011 |
| 17. | 03853 | 16.8% | 10.9%(+5.90)#17 | 13.8%(+3.00)#3,106 |
| 18. | 03833 | 16.6% | 10.9%(+5.70)#18 | 13.8%(+2.80)#3,141 |
| 19. | 03079 | 16.3% | 10.9%(+5.40)#19 | 13.8%(+2.50)#3,226 |
| 20. | 03860 | 16.3% | 10.9%(+5.40)#20 | 13.8%(+2.50)#3,241 |
| 21. | 03785 | 16.1% | 10.9%(+5.20)#21 | 13.8%(+2.30)#3,295 |
| 22. | 03303 | 15.8% | 10.9%(+4.90)#22 | 13.8%(+2.00)#3,374 |
| 23. | 03842 | 15.3% | 10.9%(+4.40)#23 | 13.8%(+1.50)#3,508 |
| 24. | 03751 | 15.3% | 10.9%(+4.40)#24 | 13.8%(+1.50)#3,517 |
| 25. | 03824 | 15.2% | 10.9%(+4.30)#25 | 13.8%(+1.40)#3,535 |
| 26. | 03755 | 14.8% | 10.9%(+3.90)#26 | 13.8%(+1.00)#3,669 |
| 27. | 03867 | 14.0% | 10.9%(+3.10)#27 | 13.8%(+0.200)#3,899 |
| 28. | 03055 | 14.0% | 10.9%(+3.10)#28 | 13.8%(+0.200)#3,903 |
| 29. | 03874 | 13.0% | 10.9%(+2.10)#29 | 13.8%(-0.800)#4,243 |
| 30. | 03813 | 13.0% | 10.9%(+2.10)#30 | 13.8%(-0.800)#4,246 |
| 31. | 03817 | 12.8% | 10.9%(+1.90)#31 | 13.8%(-1.00)#4,308 |
| 32. | 03103 | 12.2% | 10.9%(+1.30)#32 | 13.8%(-1.60)#4,528 |
| 33. | 03878 | 12.2% | 10.9%(+1.30)#33 | 13.8%(-1.60)#4,546 |
| 34. | 03263 | 12.0% | 10.9%(+1.10)#34 | 13.8%(-1.80)#4,621 |
| 35. | 03818 | 11.8% | 10.9%(+0.900)#35 | 13.8%(-2.00)#4,703 |
| 36. | 03110 | 11.7% | 10.9%(+0.800)#36 | 13.8%(-2.10)#4,740 |
| 37. | 03246 | 11.3% | 10.9%(+0.400)#37 | 13.8%(-2.50)#4,906 |
| 38. | 03743 | 11.0% | 10.9%(+0.100)#38 | 13.8%(-2.80)#5,042 |
| 39. | 03839 | 10.8% | 10.9%(-0.100)#39 | 13.8%(-3.00)#5,146 |
| 40. | 03251 | 10.6% | 10.9%(-0.300)#40 | 13.8%(-3.20)#5,234 |
| 41. | 03217 | 10.5% | 10.9%(-0.400)#41 | 13.8%(-3.30)#5,274 |
| 42. | 03106 | 10.2% | 10.9%(-0.700)#42 | 13.8%(-3.60)#5,401 |
| 43. | 03109 | 10.0% | 10.9%(-0.900)#43 | 13.8%(-3.80)#5,519 |
| 44. | 03561 | 9.8% | 10.9%(-1.10)#44 | 13.8%(-4.00)#5,605 |
| 45. | 03045 | 9.7% | 10.9%(-1.20)#45 | 13.8%(-4.10)#5,653 |
| 46. | 03598 | 9.7% | 10.9%(-1.20)#46 | 13.8%(-4.10)#5,671 |
| 47. | 03257 | 9.3% | 10.9%(-1.60)#47 | 13.8%(-4.50)#5,870 |
| 48. | 03064 | 9.1% | 10.9%(-1.80)#48 | 13.8%(-4.70)#5,962 |
| 49. | 03264 | 8.9% | 10.9%(-2.00)#49 | 13.8%(-4.90)#6,088 |
| 50. | 03773 | 8.4% | 10.9%(-2.50)#50 | 13.8%(-5.40)#6,417 |
| 51. | 03446 | 8.4% | 10.9%(-2.50)#51 | 13.8%(-5.40)#6,419 |
| 52. | 03253 | 8.2% | 10.9%(-2.70)#52 | 13.8%(-5.60)#6,565 |
| 53. | 03455 | 8.2% | 10.9%(-2.70)#53 | 13.8%(-5.60)#6,576 |
| 54. | 03782 | 8.0% | 10.9%(-2.90)#54 | 13.8%(-5.80)#6,701 |
| 55. | 03054 | 7.8% | 10.9%(-3.10)#55 | 13.8%(-6.00)#6,812 |
| 56. | 03053 | 7.8% | 10.9%(-3.10)#56 | 13.8%(-6.00)#6,814 |
| 57. | 03458 | 7.8% | 10.9%(-3.10)#57 | 13.8%(-6.00)#6,842 |
| 58. | 03278 | 7.5% | 10.9%(-3.40)#58 | 13.8%(-6.30)#7,050 |
| 59. | 03276 | 7.4% | 10.9%(-3.50)#59 | 13.8%(-6.40)#7,108 |
| 60. | 03242 | 7.1% | 10.9%(-3.80)#60 | 13.8%(-6.70)#7,329 |
| 61. | 03584 | 7.1% | 10.9%(-3.80)#61 | 13.8%(-6.70)#7,336 |
| 62. | 03285 | 6.9% | 10.9%(-4.00)#62 | 13.8%(-6.90)#7,483 |
| 63. | 03597 | 6.7% | 10.9%(-4.20)#63 | 13.8%(-7.10)#7,663 |
| 64. | 03051 | 6.1% | 10.9%(-4.80)#64 | 13.8%(-7.70)#8,128 |
| 65. | 03235 | 6.1% | 10.9%(-4.80)#65 | 13.8%(-7.70)#8,151 |
| 66. | 03835 | 6.1% | 10.9%(-4.80)#66 | 13.8%(-7.70)#8,156 |
| 67. | 03047 | 5.9% | 10.9%(-5.00)#67 | 13.8%(-7.90)#8,352 |
| 68. | 03865 | 5.8% | 10.9%(-5.10)#68 | 13.8%(-8.00)#8,424 |
| 69. | 03608 | 5.8% | 10.9%(-5.10)#69 | 13.8%(-8.00)#8,443 |
| 70. | 03602 | 5.7% | 10.9%(-5.20)#70 | 13.8%(-8.10)#8,533 |
| 71. | 03570 | 5.6% | 10.9%(-5.30)#71 | 13.8%(-8.20)#8,611 |
| 72. | 03255 | 5.4% | 10.9%(-5.50)#72 | 13.8%(-8.40)#8,807 |
| 73. | 03262 | 5.3% | 10.9%(-5.60)#73 | 13.8%(-8.50)#8,891 |
| 74. | 03581 | 5.0% | 10.9%(-5.90)#74 | 13.8%(-8.80)#9,154 |
| 75. | 03304 | 4.8% | 10.9%(-6.10)#75 | 13.8%(-9.00)#9,350 |
| 76. | 03592 | 4.8% | 10.9%(-6.10)#76 | 13.8%(-9.00)#9,383 |
| 77. | 03266 | 4.5% | 10.9%(-6.40)#77 | 13.8%(-9.30)#9,688 |
| 78. | 03603 | 4.4% | 10.9%(-6.50)#78 | 13.8%(-9.40)#9,783 |
| 79. | 03077 | 4.3% | 10.9%(-6.60)#79 | 13.8%(-9.50)#9,867 |
| 80. | 03249 | 4.3% | 10.9%(-6.60)#80 | 13.8%(-9.50)#9,882 |
| 81. | 03868 | 4.1% | 10.9%(-6.80)#81 | 13.8%(-9.70)#10,107 |
| 82. | 03307 | 4.1% | 10.9%(-6.80)#82 | 13.8%(-9.70)#10,110 |
| 83. | 03882 | 4.1% | 10.9%(-6.80)#83 | 13.8%(-9.70)#10,135 |
| 84. | 03037 | 3.8% | 10.9%(-7.10)#84 | 13.8%(-10.00)#10,497 |
| 85. | 03875 | 3.8% | 10.9%(-7.10)#85 | 13.8%(-10.00)#10,536 |
| 86. | 03076 | 3.5% | 10.9%(-7.40)#86 | 13.8%(-10.3)#10,874 |
| 87. | 03576 | 3.5% | 10.9%(-7.40)#87 | 13.8%(-10.3)#10,925 |
| 88. | 03048 | 3.3% | 10.9%(-7.60)#88 | 13.8%(-10.5)#11,214 |
| 89. | 03844 | 3.3% | 10.9%(-7.60)#89 | 13.8%(-10.5)#11,224 |
| 90. | 03452 | 3.2% | 10.9%(-7.70)#90 | 13.8%(-10.6)#11,335 |
| 91. | 03234 | 3.2% | 10.9%(-7.70)#91 | 13.8%(-10.6)#11,338 |
| 92. | 03461 | 3.0% | 10.9%(-7.90)#92 | 13.8%(-10.8)#11,630 |
| 93. | 03841 | 3.0% | 10.9%(-7.90)#93 | 13.8%(-10.8)#11,631 |
| 94. | 03275 | 2.9% | 10.9%(-8.00)#94 | 13.8%(-10.9)#11,760 |
| 95. | 03814 | 2.7% | 10.9%(-8.20)#95 | 13.8%(-11.1)#12,158 |
| 96. | 03886 | 2.7% | 10.9%(-8.20)#96 | 13.8%(-11.1)#12,180 |
| 97. | 03470 | 2.6% | 10.9%(-8.30)#97 | 13.8%(-11.2)#12,327 |
| 98. | 03465 | 2.6% | 10.9%(-8.30)#98 | 13.8%(-11.2)#12,368 |
| 99. | 03580 | 2.6% | 10.9%(-8.30)#99 | 13.8%(-11.2)#12,379 |
| 100. | 03222 | 2.5% | 10.9%(-8.40)#100 | 13.8%(-11.3)#12,476 |
Common Questions
What are the Top 10 Zip Codes with the Highest Percentage of Households Residing in Condos/Apartments in New Hampshire?
Top 10 Zip Codes with the Highest Percentage of Households Residing in Condos/Apartments in New Hampshire are:
What zip code has the Highest Percentage of Households Residing in Condos/Apartments in New Hampshire?
03101 has the Highest Percentage of Households Residing in Condos/Apartments in New Hampshire with 75.1%.
What is the Percentage of Households Residing in Condos/Apartments in the State of New Hampshire?
Percentage of Households Residing in Condos/Apartments in New Hampshire is 10.9%.
What is the Percentage of Households Residing in Condos/Apartments in the United States?
Percentage of Households Residing in Condos/Apartments in the United States is 13.8%.