Zip Codes with the Highest Percentage of Not-for-profit Organizations in New Hampshire
RELATED REPORTS & OPTIONS
Not-for-profit Organizations
New Hampshire
Compare Zip Codes
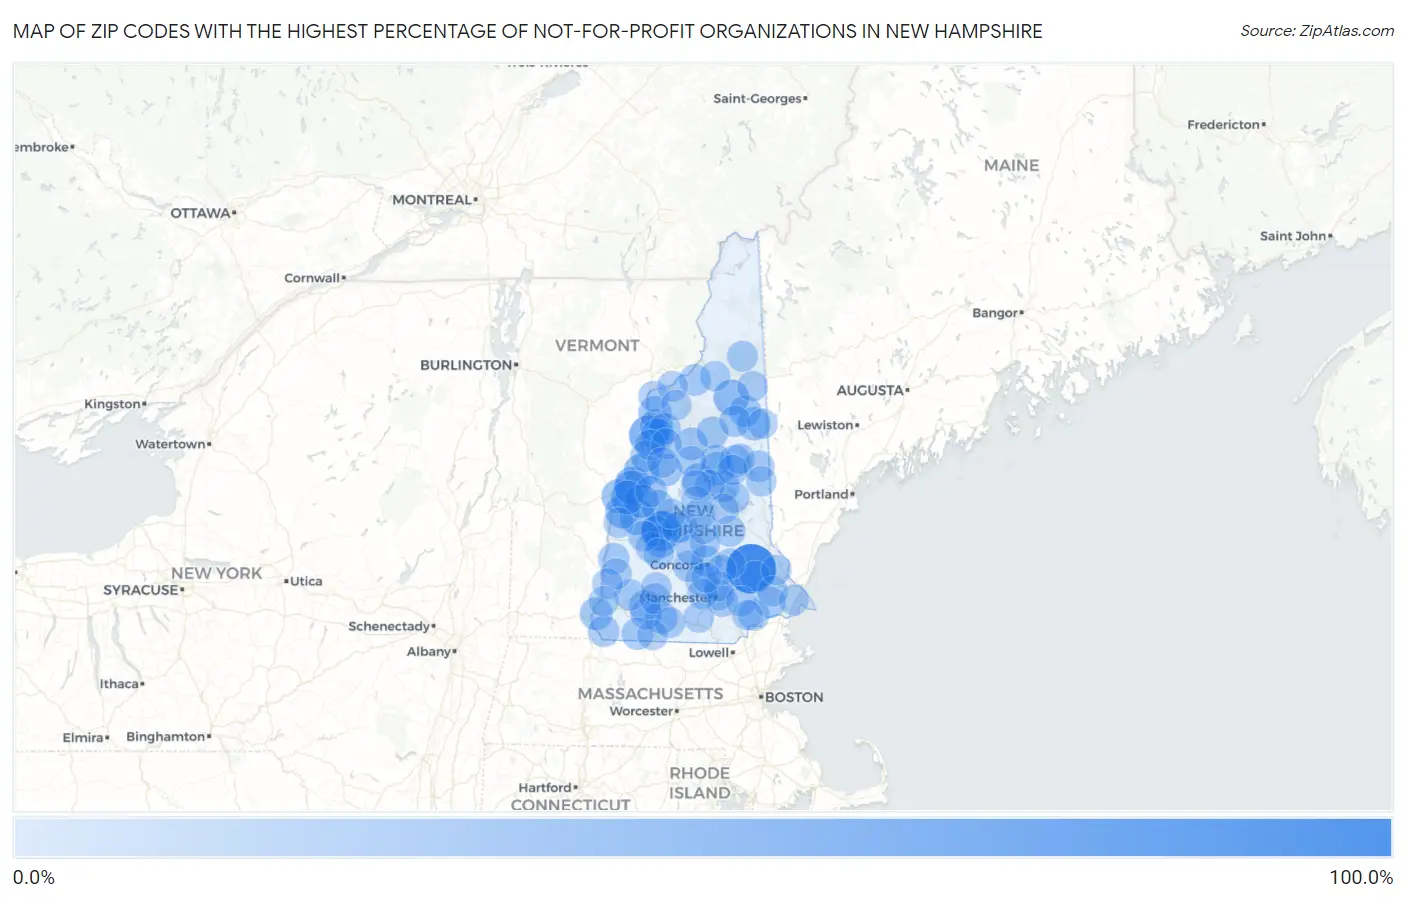
Map of Zip Codes with the Highest Percentage of Not-for-profit Organizations in New Hampshire
0.0%
100.0%
Zip Codes with the Highest Percentage of Not-for-profit Organizations in New Hampshire
| Zip Code | % Employed in Not-for-profit | vs State | vs National | |
| 1. | 03291 | 100.0% | 11.7%(+88.3)#1 | 8.4%(+91.6)#5 |
| 2. | 03233 | 53.5% | 11.7%(+41.7)#2 | 8.4%(+45.0)#110 |
| 3. | 03765 | 53.1% | 11.7%(+41.4)#3 | 8.4%(+44.7)#112 |
| 4. | 03755 | 39.3% | 11.7%(+27.5)#4 | 8.4%(+30.8)#244 |
| 5. | 03593 | 36.6% | 11.7%(+24.9)#5 | 8.4%(+28.2)#291 |
| 6. | 03753 | 36.2% | 11.7%(+24.5)#6 | 8.4%(+27.8)#301 |
| 7. | 03768 | 34.1% | 11.7%(+22.4)#7 | 8.4%(+25.7)#340 |
| 8. | 03784 | 30.9% | 11.7%(+19.2)#8 | 8.4%(+22.5)#417 |
| 9. | 03781 | 30.8% | 11.7%(+19.1)#9 | 8.4%(+22.4)#420 |
| 10. | 03750 | 29.7% | 11.7%(+18.0)#10 | 8.4%(+21.3)#456 |
| 11. | 03748 | 28.8% | 11.7%(+17.1)#11 | 8.4%(+20.4)#487 |
| 12. | 03766 | 28.8% | 11.7%(+17.0)#12 | 8.4%(+20.3)#490 |
| 13. | 03774 | 27.8% | 11.7%(+16.0)#13 | 8.4%(+19.3)#533 |
| 14. | 03227 | 27.6% | 11.7%(+15.9)#14 | 8.4%(+19.1)#541 |
| 15. | 03845 | 27.1% | 11.7%(+15.3)#15 | 8.4%(+18.6)#572 |
| 16. | 03245 | 26.9% | 11.7%(+15.2)#16 | 8.4%(+18.5)#576 |
| 17. | 03740 | 25.6% | 11.7%(+13.9)#17 | 8.4%(+17.2)#656 |
| 18. | 03260 | 24.6% | 11.7%(+12.8)#18 | 8.4%(+16.1)#734 |
| 19. | 03780 | 24.3% | 11.7%(+12.5)#19 | 8.4%(+15.8)#754 |
| 20. | 03466 | 24.1% | 11.7%(+12.4)#20 | 8.4%(+15.7)#770 |
| 21. | 03458 | 23.4% | 11.7%(+11.6)#21 | 8.4%(+14.9)#843 |
| 22. | 03293 | 22.6% | 11.7%(+10.8)#22 | 8.4%(+14.1)#941 |
| 23. | 03240 | 21.9% | 11.7%(+10.2)#23 | 8.4%(+13.5)#1,011 |
| 24. | 03266 | 21.1% | 11.7%(+9.35)#24 | 8.4%(+12.6)#1,135 |
| 25. | 03450 | 21.1% | 11.7%(+9.33)#25 | 8.4%(+12.6)#1,138 |
| 26. | 03846 | 20.6% | 11.7%(+8.88)#26 | 8.4%(+12.2)#1,203 |
| 27. | 03886 | 20.5% | 11.7%(+8.73)#27 | 8.4%(+12.0)#1,219 |
| 28. | 03231 | 20.3% | 11.7%(+8.53)#28 | 8.4%(+11.8)#1,249 |
| 29. | 03447 | 20.3% | 11.7%(+8.52)#29 | 8.4%(+11.8)#1,254 |
| 30. | 03215 | 19.7% | 11.7%(+7.92)#30 | 8.4%(+11.2)#1,352 |
| 31. | 03287 | 19.4% | 11.7%(+7.68)#31 | 8.4%(+11.0)#1,403 |
| 32. | 03741 | 19.1% | 11.7%(+7.34)#32 | 8.4%(+10.6)#1,473 |
| 33. | 03257 | 19.0% | 11.7%(+7.23)#33 | 8.4%(+10.5)#1,494 |
| 34. | 03777 | 18.9% | 11.7%(+7.13)#34 | 8.4%(+10.4)#1,511 |
| 35. | 03444 | 18.7% | 11.7%(+6.94)#35 | 8.4%(+10.2)#1,551 |
| 36. | 03441 | 18.5% | 11.7%(+6.78)#36 | 8.4%(+10.1)#1,581 |
| 37. | 03046 | 18.5% | 11.7%(+6.75)#37 | 8.4%(+10.0)#1,586 |
| 38. | 03785 | 18.4% | 11.7%(+6.67)#38 | 8.4%(+9.97)#1,600 |
| 39. | 03836 | 18.3% | 11.7%(+6.60)#39 | 8.4%(+9.89)#1,620 |
| 40. | 03254 | 18.3% | 11.7%(+6.53)#40 | 8.4%(+9.83)#1,635 |
| 41. | 03598 | 18.2% | 11.7%(+6.50)#41 | 8.4%(+9.79)#1,647 |
| 42. | 03812 | 18.1% | 11.7%(+6.32)#42 | 8.4%(+9.61)#1,695 |
| 43. | 03229 | 18.0% | 11.7%(+6.25)#43 | 8.4%(+9.55)#1,712 |
| 44. | 03603 | 17.6% | 11.7%(+5.84)#44 | 8.4%(+9.13)#1,841 |
| 45. | 03826 | 17.6% | 11.7%(+5.83)#45 | 8.4%(+9.13)#1,844 |
| 46. | 03445 | 17.4% | 11.7%(+5.66)#46 | 8.4%(+8.96)#1,894 |
| 47. | 03833 | 17.1% | 11.7%(+5.32)#47 | 8.4%(+8.61)#2,007 |
| 48. | 03853 | 16.6% | 11.7%(+4.81)#48 | 8.4%(+8.11)#2,205 |
| 49. | 03109 | 16.5% | 11.7%(+4.74)#49 | 8.4%(+8.04)#2,240 |
| 50. | 03255 | 16.4% | 11.7%(+4.63)#50 | 8.4%(+7.93)#2,292 |
| 51. | 03782 | 16.2% | 11.7%(+4.46)#51 | 8.4%(+7.75)#2,358 |
| 52. | 03104 | 16.1% | 11.7%(+4.37)#52 | 8.4%(+7.67)#2,399 |
| 53. | 03301 | 16.0% | 11.7%(+4.29)#53 | 8.4%(+7.58)#2,439 |
| 54. | 03837 | 15.9% | 11.7%(+4.16)#54 | 8.4%(+7.45)#2,487 |
| 55. | 03779 | 15.8% | 11.7%(+4.06)#55 | 8.4%(+7.36)#2,530 |
| 56. | 03216 | 15.7% | 11.7%(+3.92)#56 | 8.4%(+7.22)#2,595 |
| 57. | 03238 | 15.6% | 11.7%(+3.89)#57 | 8.4%(+7.18)#2,616 |
| 58. | 03570 | 15.6% | 11.7%(+3.82)#58 | 8.4%(+7.12)#2,647 |
| 59. | 03259 | 15.5% | 11.7%(+3.76)#59 | 8.4%(+7.06)#2,679 |
| 60. | 03771 | 15.2% | 11.7%(+3.42)#60 | 8.4%(+6.72)#2,846 |
| 61. | 03602 | 15.2% | 11.7%(+3.41)#61 | 8.4%(+6.71)#2,848 |
| 62. | 03226 | 14.9% | 11.7%(+3.15)#62 | 8.4%(+6.45)#3,003 |
| 63. | 03282 | 14.8% | 11.7%(+3.05)#63 | 8.4%(+6.34)#3,071 |
| 64. | 03223 | 14.7% | 11.7%(+3.00)#64 | 8.4%(+6.29)#3,094 |
| 65. | 03608 | 14.6% | 11.7%(+2.89)#65 | 8.4%(+6.18)#3,162 |
| 66. | 03303 | 14.6% | 11.7%(+2.88)#66 | 8.4%(+6.18)#3,167 |
| 67. | 03449 | 14.5% | 11.7%(+2.78)#67 | 8.4%(+6.07)#3,223 |
| 68. | 03290 | 14.5% | 11.7%(+2.76)#68 | 8.4%(+6.06)#3,236 |
| 69. | 03234 | 14.5% | 11.7%(+2.75)#69 | 8.4%(+6.04)#3,244 |
| 70. | 03440 | 14.5% | 11.7%(+2.74)#70 | 8.4%(+6.03)#3,252 |
| 71. | 03561 | 14.4% | 11.7%(+2.70)#71 | 8.4%(+5.99)#3,284 |
| 72. | 03269 | 14.4% | 11.7%(+2.67)#72 | 8.4%(+5.97)#3,301 |
| 73. | 03221 | 14.4% | 11.7%(+2.66)#73 | 8.4%(+5.95)#3,314 |
| 74. | 03106 | 14.4% | 11.7%(+2.63)#74 | 8.4%(+5.92)#3,332 |
| 75. | 03581 | 14.1% | 11.7%(+2.34)#75 | 8.4%(+5.63)#3,525 |
| 76. | 03817 | 14.1% | 11.7%(+2.33)#76 | 8.4%(+5.62)#3,533 |
| 77. | 03856 | 14.0% | 11.7%(+2.29)#77 | 8.4%(+5.58)#3,568 |
| 78. | 03036 | 14.0% | 11.7%(+2.28)#78 | 8.4%(+5.58)#3,576 |
| 79. | 03084 | 13.9% | 11.7%(+2.19)#79 | 8.4%(+5.48)#3,651 |
| 80. | 03882 | 13.9% | 11.7%(+2.14)#80 | 8.4%(+5.43)#3,688 |
| 81. | 03045 | 13.9% | 11.7%(+2.13)#81 | 8.4%(+5.42)#3,698 |
| 82. | 03883 | 13.8% | 11.7%(+2.03)#82 | 8.4%(+5.33)#3,786 |
| 83. | 03275 | 13.7% | 11.7%(+1.99)#83 | 8.4%(+5.28)#3,823 |
| 84. | 03461 | 13.7% | 11.7%(+1.95)#84 | 8.4%(+5.25)#3,853 |
| 85. | 03586 | 13.6% | 11.7%(+1.83)#85 | 8.4%(+5.12)#3,954 |
| 86. | 03745 | 13.4% | 11.7%(+1.67)#86 | 8.4%(+4.97)#4,101 |
| 87. | 03230 | 13.4% | 11.7%(+1.66)#87 | 8.4%(+4.96)#4,116 |
| 88. | 03224 | 13.4% | 11.7%(+1.64)#88 | 8.4%(+4.94)#4,134 |
| 89. | 03841 | 13.4% | 11.7%(+1.63)#89 | 8.4%(+4.92)#4,150 |
| 90. | 03276 | 13.3% | 11.7%(+1.61)#90 | 8.4%(+4.90)#4,161 |
| 91. | 03467 | 13.2% | 11.7%(+1.51)#91 | 8.4%(+4.80)#4,272 |
| 92. | 03583 | 13.2% | 11.7%(+1.51)#92 | 8.4%(+4.80)#4,274 |
| 93. | 03256 | 13.2% | 11.7%(+1.45)#93 | 8.4%(+4.75)#4,320 |
| 94. | 03217 | 13.1% | 11.7%(+1.35)#94 | 8.4%(+4.64)#4,431 |
| 95. | 03871 | 13.1% | 11.7%(+1.34)#95 | 8.4%(+4.64)#4,437 |
| 96. | 03031 | 13.0% | 11.7%(+1.31)#96 | 8.4%(+4.60)#4,461 |
| 97. | 03304 | 13.0% | 11.7%(+1.25)#97 | 8.4%(+4.55)#4,517 |
| 98. | 03823 | 13.0% | 11.7%(+1.23)#98 | 8.4%(+4.53)#4,533 |
| 99. | 03249 | 12.9% | 11.7%(+1.18)#99 | 8.4%(+4.47)#4,578 |
| 100. | 03813 | 12.9% | 11.7%(+1.12)#100 | 8.4%(+4.42)#4,633 |
Common Questions
What are the Top 10 Zip Codes with the Highest Percentage of Not-for-profit Organizations in New Hampshire?
Top 10 Zip Codes with the Highest Percentage of Not-for-profit Organizations in New Hampshire are:
What zip code has the Highest Percentage of Not-for-profit Organizations in New Hampshire?
03291 has the Highest Percentage of Not-for-profit Organizations in New Hampshire with 100.0%.
What is the Percentage of Not-for-profit Organizations in the State of New Hampshire?
Percentage of Not-for-profit Organizations in New Hampshire is 11.7%.
What is the Percentage of Not-for-profit Organizations in the United States?
Percentage of Not-for-profit Organizations in the United States is 8.4%.