Zip Codes with the Highest Percentage of Households With Three or more Vehicles in New Hampshire
RELATED REPORTS & OPTIONS
Households with 3 or more Cars
New Hampshire
Compare Zip Codes
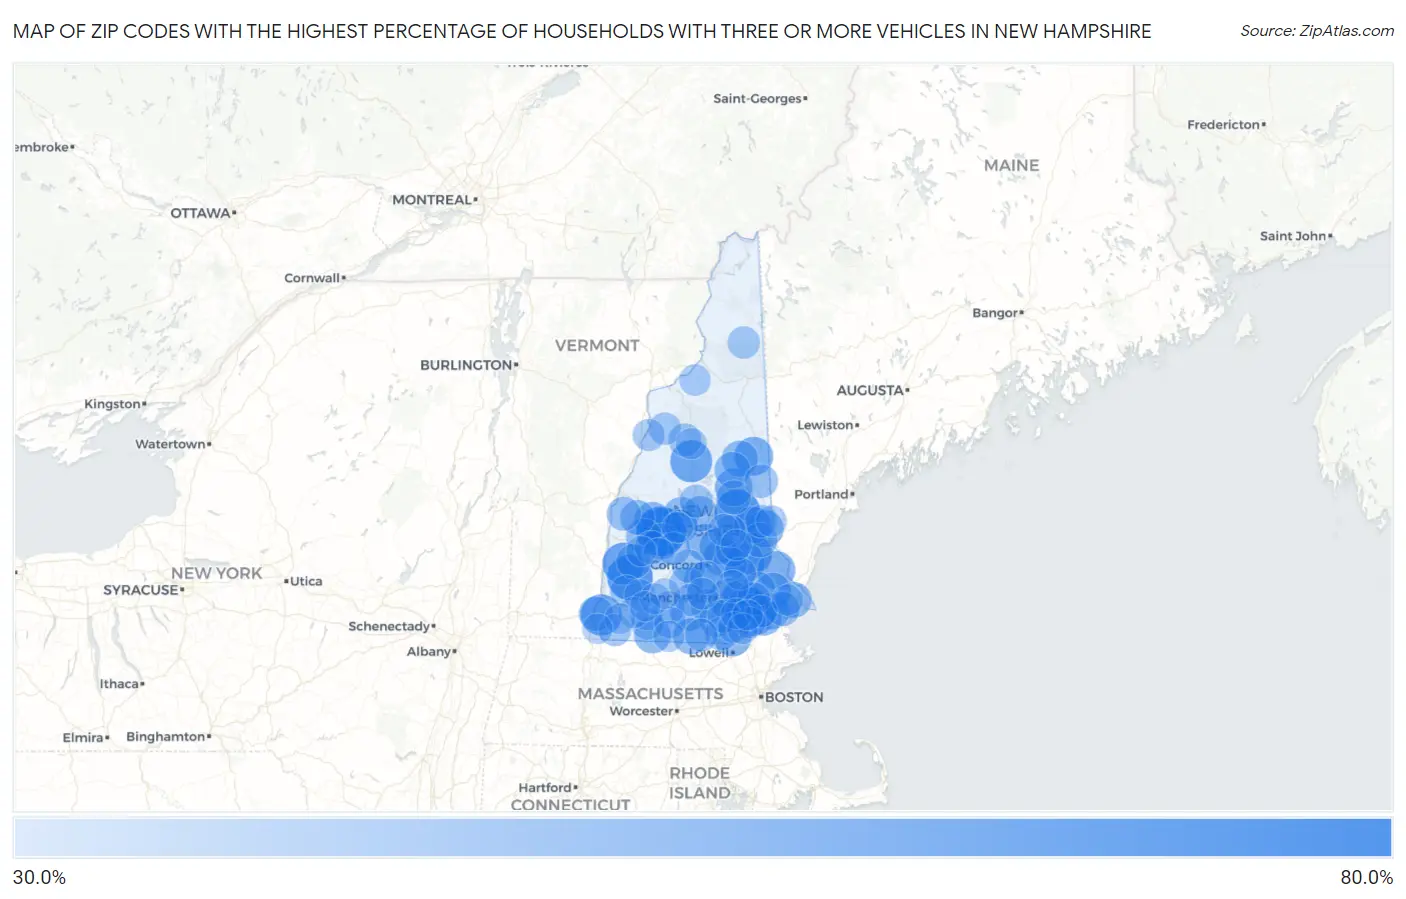
Map of Zip Codes with the Highest Percentage of Households With Three or more Vehicles in New Hampshire
30.0%
80.0%
Zip Codes with the Highest Percentage of Households With Three or more Vehicles in New Hampshire
| Zip Code | Housholds With 3+ Cars | vs State | vs National | |
| 1. | 03233 | 64.0% | 29.5%(+34.5)#1 | 29.0%(+35.0)#1,096 |
| 2. | 03810 | 57.8% | 29.5%(+28.3)#2 | 29.0%(+28.8)#1,777 |
| 3. | 03456 | 57.3% | 29.5%(+27.8)#3 | 29.0%(+28.3)#1,851 |
| 4. | 03036 | 51.9% | 29.5%(+22.4)#4 | 29.0%(+22.9)#2,942 |
| 5. | 03607 | 51.8% | 29.5%(+22.3)#5 | 29.0%(+22.8)#2,988 |
| 6. | 03223 | 51.2% | 29.5%(+21.7)#6 | 29.0%(+22.2)#3,127 |
| 7. | 03873 | 51.1% | 29.5%(+21.6)#7 | 29.0%(+22.1)#3,154 |
| 8. | 03884 | 50.3% | 29.5%(+20.8)#8 | 29.0%(+21.3)#3,390 |
| 9. | 03443 | 50.2% | 29.5%(+20.7)#9 | 29.0%(+21.2)#3,440 |
| 10. | 03826 | 50.1% | 29.5%(+20.6)#10 | 29.0%(+21.1)#3,455 |
| 11. | 03032 | 47.9% | 29.5%(+18.4)#11 | 29.0%(+18.9)#4,256 |
| 12. | 03261 | 46.9% | 29.5%(+17.4)#12 | 29.0%(+17.9)#4,688 |
| 13. | 03849 | 46.1% | 29.5%(+16.6)#13 | 29.0%(+17.1)#5,032 |
| 14. | 03823 | 44.6% | 29.5%(+15.1)#14 | 29.0%(+15.6)#5,739 |
| 15. | 03076 | 44.4% | 29.5%(+14.9)#15 | 29.0%(+15.4)#5,810 |
| 16. | 03258 | 44.4% | 29.5%(+14.9)#16 | 29.0%(+15.4)#5,830 |
| 17. | 03850 | 44.4% | 29.5%(+14.9)#17 | 29.0%(+15.4)#5,873 |
| 18. | 03224 | 43.5% | 29.5%(+14.0)#18 | 29.0%(+14.5)#6,342 |
| 19. | 03851 | 43.4% | 29.5%(+13.9)#19 | 29.0%(+14.4)#6,400 |
| 20. | 03855 | 43.4% | 29.5%(+13.9)#20 | 29.0%(+14.4)#6,405 |
| 21. | 03287 | 43.4% | 29.5%(+13.9)#21 | 29.0%(+14.4)#6,414 |
| 22. | 03856 | 43.2% | 29.5%(+13.7)#22 | 29.0%(+14.2)#6,518 |
| 23. | 03057 | 43.0% | 29.5%(+13.5)#23 | 29.0%(+14.0)#6,621 |
| 24. | 03461 | 42.4% | 29.5%(+12.9)#24 | 29.0%(+13.4)#6,972 |
| 25. | 03307 | 42.4% | 29.5%(+12.9)#25 | 29.0%(+13.4)#6,974 |
| 26. | 03827 | 41.8% | 29.5%(+12.3)#26 | 29.0%(+12.8)#7,362 |
| 27. | 03033 | 41.7% | 29.5%(+12.2)#27 | 29.0%(+12.7)#7,420 |
| 28. | 03817 | 41.6% | 29.5%(+12.1)#28 | 29.0%(+12.6)#7,516 |
| 29. | 03858 | 41.5% | 29.5%(+12.0)#29 | 29.0%(+12.5)#7,549 |
| 30. | 03243 | 41.5% | 29.5%(+12.0)#30 | 29.0%(+12.5)#7,573 |
| 31. | 03284 | 41.5% | 29.5%(+12.0)#31 | 29.0%(+12.5)#7,575 |
| 32. | 03883 | 41.4% | 29.5%(+11.9)#32 | 29.0%(+12.4)#7,638 |
| 33. | 03260 | 41.2% | 29.5%(+11.7)#33 | 29.0%(+12.2)#7,751 |
| 34. | 03871 | 41.0% | 29.5%(+11.5)#34 | 29.0%(+12.0)#7,896 |
| 35. | 03782 | 40.7% | 29.5%(+11.2)#35 | 29.0%(+11.7)#8,057 |
| 36. | 03269 | 40.6% | 29.5%(+11.1)#36 | 29.0%(+11.6)#8,139 |
| 37. | 03046 | 39.8% | 29.5%(+10.3)#37 | 29.0%(+10.8)#8,721 |
| 38. | 03835 | 39.5% | 29.5%(+10.0)#38 | 29.0%(+10.5)#8,911 |
| 39. | 03605 | 39.4% | 29.5%(+9.90)#39 | 29.0%(+10.4)#9,000 |
| 40. | 03753 | 39.1% | 29.5%(+9.60)#40 | 29.0%(+10.1)#9,226 |
| 41. | 03466 | 39.0% | 29.5%(+9.50)#41 | 29.0%(+10.0)#9,325 |
| 42. | 03844 | 38.7% | 29.5%(+9.20)#42 | 29.0%(+9.70)#9,572 |
| 43. | 03853 | 38.6% | 29.5%(+9.10)#43 | 29.0%(+9.60)#9,687 |
| 44. | 03052 | 38.5% | 29.5%(+9.00)#44 | 29.0%(+9.50)#9,722 |
| 45. | 03234 | 38.5% | 29.5%(+9.00)#45 | 29.0%(+9.50)#9,729 |
| 46. | 03110 | 38.3% | 29.5%(+8.80)#46 | 29.0%(+9.30)#9,869 |
| 47. | 03770 | 37.9% | 29.5%(+8.40)#47 | 29.0%(+8.90)#10,241 |
| 48. | 03281 | 37.8% | 29.5%(+8.30)#48 | 29.0%(+8.80)#10,276 |
| 49. | 03263 | 37.8% | 29.5%(+8.30)#49 | 29.0%(+8.80)#10,294 |
| 50. | 03882 | 37.4% | 29.5%(+7.90)#50 | 29.0%(+8.40)#10,647 |
| 51. | 03231 | 37.3% | 29.5%(+7.80)#51 | 29.0%(+8.30)#10,753 |
| 52. | 03229 | 37.1% | 29.5%(+7.60)#52 | 29.0%(+8.10)#10,857 |
| 53. | 03255 | 37.0% | 29.5%(+7.50)#53 | 29.0%(+8.00)#10,962 |
| 54. | 03051 | 36.9% | 29.5%(+7.40)#54 | 29.0%(+7.90)#11,019 |
| 55. | 03042 | 36.8% | 29.5%(+7.30)#55 | 29.0%(+7.80)#11,128 |
| 56. | 03278 | 36.8% | 29.5%(+7.30)#56 | 29.0%(+7.80)#11,139 |
| 57. | 03256 | 36.7% | 29.5%(+7.20)#57 | 29.0%(+7.70)#11,243 |
| 58. | 03262 | 36.7% | 29.5%(+7.20)#58 | 29.0%(+7.70)#11,267 |
| 59. | 03044 | 36.6% | 29.5%(+7.10)#59 | 29.0%(+7.60)#11,327 |
| 60. | 03053 | 36.5% | 29.5%(+7.00)#60 | 29.0%(+7.50)#11,400 |
| 61. | 03304 | 36.5% | 29.5%(+7.00)#61 | 29.0%(+7.50)#11,411 |
| 62. | 03444 | 36.2% | 29.5%(+6.70)#62 | 29.0%(+7.20)#11,729 |
| 63. | 03049 | 36.1% | 29.5%(+6.60)#63 | 29.0%(+7.10)#11,796 |
| 64. | 03887 | 36.0% | 29.5%(+6.50)#64 | 29.0%(+7.00)#11,900 |
| 65. | 03037 | 35.5% | 29.5%(+6.00)#65 | 29.0%(+6.50)#12,322 |
| 66. | 03034 | 35.5% | 29.5%(+6.00)#66 | 29.0%(+6.50)#12,326 |
| 67. | 03785 | 35.5% | 29.5%(+6.00)#67 | 29.0%(+6.50)#12,346 |
| 68. | 03837 | 35.5% | 29.5%(+6.00)#68 | 29.0%(+6.50)#12,353 |
| 69. | 03047 | 35.4% | 29.5%(+5.90)#69 | 29.0%(+6.40)#12,458 |
| 70. | 03588 | 35.4% | 29.5%(+5.90)#70 | 29.0%(+6.40)#12,462 |
| 71. | 03448 | 35.4% | 29.5%(+5.90)#71 | 29.0%(+6.40)#12,472 |
| 72. | 03452 | 35.2% | 29.5%(+5.70)#72 | 29.0%(+6.20)#12,641 |
| 73. | 03848 | 35.1% | 29.5%(+5.60)#73 | 29.0%(+6.10)#12,731 |
| 74. | 03470 | 35.1% | 29.5%(+5.60)#74 | 29.0%(+6.10)#12,740 |
| 75. | 03237 | 35.0% | 29.5%(+5.50)#75 | 29.0%(+6.00)#12,854 |
| 76. | 03765 | 35.0% | 29.5%(+5.50)#76 | 29.0%(+6.00)#12,874 |
| 77. | 03070 | 34.8% | 29.5%(+5.30)#77 | 29.0%(+5.80)#13,024 |
| 78. | 03045 | 34.4% | 29.5%(+4.90)#78 | 29.0%(+5.40)#13,369 |
| 79. | 03084 | 34.1% | 29.5%(+4.60)#79 | 29.0%(+5.10)#13,741 |
| 80. | 03221 | 34.0% | 29.5%(+4.50)#80 | 29.0%(+5.00)#13,842 |
| 81. | 03811 | 33.8% | 29.5%(+4.30)#81 | 29.0%(+4.80)#14,034 |
| 82. | 03457 | 33.8% | 29.5%(+4.30)#82 | 29.0%(+4.80)#14,074 |
| 83. | 03862 | 33.7% | 29.5%(+4.20)#83 | 29.0%(+4.70)#14,148 |
| 84. | 03598 | 33.7% | 29.5%(+4.20)#84 | 29.0%(+4.70)#14,154 |
| 85. | 03087 | 33.6% | 29.5%(+4.10)#85 | 29.0%(+4.60)#14,224 |
| 86. | 03071 | 33.5% | 29.5%(+4.00)#86 | 29.0%(+4.50)#14,334 |
| 87. | 03455 | 33.5% | 29.5%(+4.00)#87 | 29.0%(+4.50)#14,350 |
| 88. | 03218 | 33.3% | 29.5%(+3.80)#88 | 29.0%(+4.30)#14,557 |
| 89. | 03852 | 33.3% | 29.5%(+3.80)#89 | 29.0%(+4.30)#14,586 |
| 90. | 03293 | 33.3% | 29.5%(+3.80)#90 | 29.0%(+4.30)#14,613 |
| 91. | 03038 | 33.1% | 29.5%(+3.60)#91 | 29.0%(+4.10)#14,720 |
| 92. | 03216 | 33.0% | 29.5%(+3.50)#92 | 29.0%(+4.00)#14,878 |
| 93. | 03446 | 32.9% | 29.5%(+3.40)#93 | 29.0%(+3.90)#14,956 |
| 94. | 03449 | 32.9% | 29.5%(+3.40)#94 | 29.0%(+3.90)#14,974 |
| 95. | 03079 | 32.8% | 29.5%(+3.30)#95 | 29.0%(+3.80)#15,016 |
| 96. | 03841 | 32.8% | 29.5%(+3.30)#96 | 29.0%(+3.80)#15,047 |
| 97. | 03442 | 32.4% | 29.5%(+2.90)#97 | 29.0%(+3.40)#15,471 |
| 98. | 03450 | 32.4% | 29.5%(+2.90)#98 | 29.0%(+3.40)#15,479 |
| 99. | 03451 | 32.0% | 29.5%(+2.50)#99 | 29.0%(+3.00)#15,853 |
| 100. | 03752 | 32.0% | 29.5%(+2.50)#100 | 29.0%(+3.00)#15,883 |
Common Questions
What are the Top 10 Zip Codes with the Highest Percentage of Households With Three or more Vehicles in New Hampshire?
Top 10 Zip Codes with the Highest Percentage of Households With Three or more Vehicles in New Hampshire are:
What zip code has the Highest Percentage of Households With Three or more Vehicles in New Hampshire?
03233 has the Highest Percentage of Households With Three or more Vehicles in New Hampshire with 64.0%.
What is the Percentage of Households With Three or more Vehicles in the State of New Hampshire?
Percentage of Households With Three or more Vehicles in New Hampshire is 29.5%.
What is the Percentage of Households With Three or more Vehicles in the United States?
Percentage of Households With Three or more Vehicles in the United States is 29.0%.