Zip Codes with the Highest Percentage of Population Enrolled in Nursery / Preschool in New Hampshire
RELATED REPORTS & OPTIONS
Nursery / Preschool
New Hampshire
Compare Zip Codes
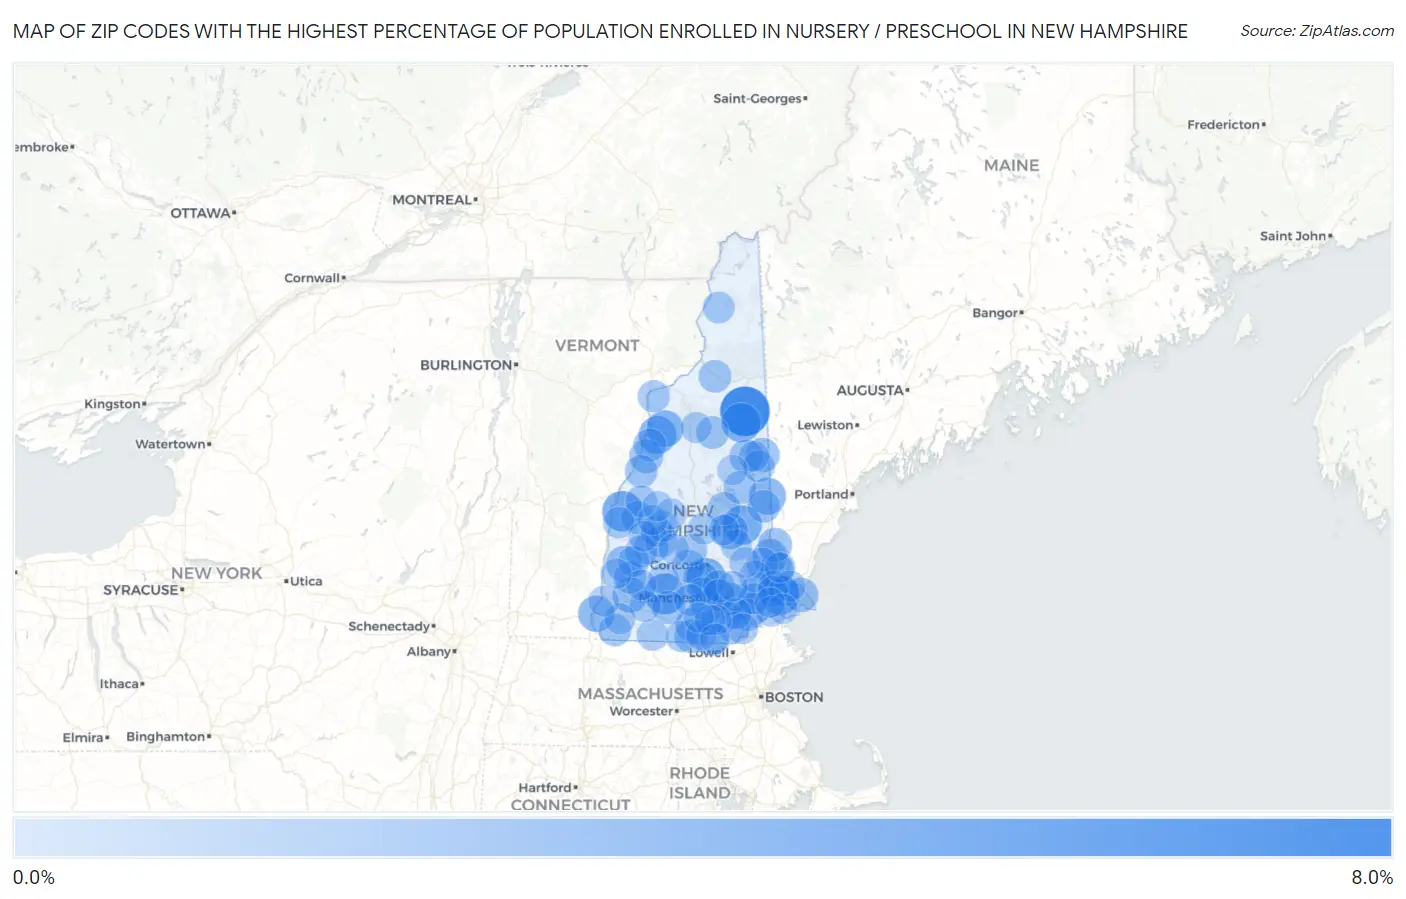
Map of Zip Codes with the Highest Percentage of Population Enrolled in Nursery / Preschool in New Hampshire
0.0%
8.0%
Zip Codes with the Highest Percentage of Population Enrolled in Nursery / Preschool in New Hampshire
| Zip Code | % in Nursery | vs State | vs National | |
| 1. | 03846 | 7.1% | 1.3%(+5.75)#1 | 1.4%(+5.63)#298 |
| 2. | 03442 | 4.5% | 1.3%(+3.17)#2 | 1.4%(+3.05)#827 |
| 3. | 03781 | 4.4% | 1.3%(+3.03)#3 | 1.4%(+2.91)#889 |
| 4. | 03838 | 4.0% | 1.3%(+2.68)#4 | 1.4%(+2.56)#1,085 |
| 5. | 03885 | 4.0% | 1.3%(+2.65)#5 | 1.4%(+2.53)#1,105 |
| 6. | 03809 | 3.9% | 1.3%(+2.62)#6 | 1.4%(+2.50)#1,122 |
| 7. | 03304 | 3.9% | 1.3%(+2.56)#7 | 1.4%(+2.44)#1,161 |
| 8. | 03780 | 3.6% | 1.3%(+2.26)#8 | 1.4%(+2.14)#1,420 |
| 9. | 03830 | 3.3% | 1.3%(+2.01)#9 | 1.4%(+1.89)#1,693 |
| 10. | 03785 | 3.3% | 1.3%(+1.99)#10 | 1.4%(+1.87)#1,720 |
| 11. | 03046 | 3.1% | 1.3%(+1.82)#11 | 1.4%(+1.70)#1,954 |
| 12. | 03466 | 3.1% | 1.3%(+1.79)#12 | 1.4%(+1.67)#2,014 |
| 13. | 03837 | 3.0% | 1.3%(+1.70)#13 | 1.4%(+1.58)#2,139 |
| 14. | 03607 | 2.9% | 1.3%(+1.56)#14 | 1.4%(+1.44)#2,449 |
| 15. | 03445 | 2.8% | 1.3%(+1.44)#15 | 1.4%(+1.32)#2,714 |
| 16. | 03823 | 2.7% | 1.3%(+1.39)#16 | 1.4%(+1.27)#2,841 |
| 17. | 03839 | 2.6% | 1.3%(+1.32)#17 | 1.4%(+1.20)#3,036 |
| 18. | 03870 | 2.6% | 1.3%(+1.23)#18 | 1.4%(+1.11)#3,319 |
| 19. | 03832 | 2.5% | 1.3%(+1.22)#19 | 1.4%(+1.10)#3,350 |
| 20. | 03868 | 2.5% | 1.3%(+1.15)#20 | 1.4%(+1.03)#3,583 |
| 21. | 03055 | 2.5% | 1.3%(+1.13)#21 | 1.4%(+1.01)#3,693 |
| 22. | 03255 | 2.4% | 1.3%(+1.11)#22 | 1.4%(+0.988)#3,757 |
| 23. | 03777 | 2.4% | 1.3%(+1.06)#23 | 1.4%(+0.937)#3,972 |
| 24. | 03062 | 2.3% | 1.3%(+1.02)#24 | 1.4%(+0.900)#4,139 |
| 25. | 03036 | 2.3% | 1.3%(+0.992)#25 | 1.4%(+0.872)#4,247 |
| 26. | 03875 | 2.3% | 1.3%(+0.984)#26 | 1.4%(+0.864)#4,285 |
| 27. | 03033 | 2.3% | 1.3%(+0.969)#27 | 1.4%(+0.849)#4,345 |
| 28. | 03047 | 2.2% | 1.3%(+0.890)#28 | 1.4%(+0.771)#4,732 |
| 29. | 03110 | 2.2% | 1.3%(+0.859)#29 | 1.4%(+0.739)#4,901 |
| 30. | 03779 | 2.2% | 1.3%(+0.838)#30 | 1.4%(+0.718)#5,018 |
| 31. | 03229 | 2.2% | 1.3%(+0.835)#31 | 1.4%(+0.715)#5,035 |
| 32. | 03249 | 2.2% | 1.3%(+0.834)#32 | 1.4%(+0.714)#5,047 |
| 33. | 03053 | 2.1% | 1.3%(+0.816)#33 | 1.4%(+0.696)#5,141 |
| 34. | 03816 | 2.1% | 1.3%(+0.789)#34 | 1.4%(+0.669)#5,287 |
| 35. | 03753 | 2.1% | 1.3%(+0.785)#35 | 1.4%(+0.665)#5,313 |
| 36. | 03032 | 2.1% | 1.3%(+0.778)#36 | 1.4%(+0.658)#5,365 |
| 37. | 03045 | 2.1% | 1.3%(+0.761)#37 | 1.4%(+0.641)#5,486 |
| 38. | 03042 | 2.1% | 1.3%(+0.747)#38 | 1.4%(+0.627)#5,591 |
| 39. | 03768 | 2.1% | 1.3%(+0.743)#39 | 1.4%(+0.623)#5,625 |
| 40. | 03872 | 2.1% | 1.3%(+0.740)#40 | 1.4%(+0.620)#5,651 |
| 41. | 03583 | 2.1% | 1.3%(+0.736)#41 | 1.4%(+0.616)#5,673 |
| 42. | 03215 | 2.1% | 1.3%(+0.730)#42 | 1.4%(+0.610)#5,712 |
| 43. | 03456 | 2.0% | 1.3%(+0.702)#43 | 1.4%(+0.583)#5,889 |
| 44. | 03470 | 2.0% | 1.3%(+0.690)#44 | 1.4%(+0.570)#5,977 |
| 45. | 03819 | 2.0% | 1.3%(+0.685)#45 | 1.4%(+0.565)#6,004 |
| 46. | 03260 | 2.0% | 1.3%(+0.623)#46 | 1.4%(+0.503)#6,484 |
| 47. | 03771 | 1.9% | 1.3%(+0.568)#47 | 1.4%(+0.448)#6,872 |
| 48. | 03752 | 1.9% | 1.3%(+0.562)#48 | 1.4%(+0.442)#6,916 |
| 49. | 03106 | 1.9% | 1.3%(+0.556)#49 | 1.4%(+0.436)#6,966 |
| 50. | 03836 | 1.9% | 1.3%(+0.549)#50 | 1.4%(+0.429)#7,033 |
| 51. | 03841 | 1.9% | 1.3%(+0.539)#51 | 1.4%(+0.419)#7,121 |
| 52. | 03825 | 1.9% | 1.3%(+0.533)#52 | 1.4%(+0.413)#7,159 |
| 53. | 03303 | 1.8% | 1.3%(+0.485)#53 | 1.4%(+0.365)#7,608 |
| 54. | 03104 | 1.8% | 1.3%(+0.482)#54 | 1.4%(+0.362)#7,633 |
| 55. | 03290 | 1.8% | 1.3%(+0.478)#55 | 1.4%(+0.358)#7,673 |
| 56. | 03597 | 1.8% | 1.3%(+0.477)#56 | 1.4%(+0.357)#7,695 |
| 57. | 03748 | 1.8% | 1.3%(+0.443)#57 | 1.4%(+0.323)#8,014 |
| 58. | 03257 | 1.8% | 1.3%(+0.441)#58 | 1.4%(+0.321)#8,030 |
| 59. | 03287 | 1.8% | 1.3%(+0.429)#59 | 1.4%(+0.309)#8,146 |
| 60. | 03461 | 1.7% | 1.3%(+0.417)#60 | 1.4%(+0.298)#8,261 |
| 61. | 03857 | 1.7% | 1.3%(+0.416)#61 | 1.4%(+0.296)#8,273 |
| 62. | 03087 | 1.7% | 1.3%(+0.408)#62 | 1.4%(+0.288)#8,351 |
| 63. | 03070 | 1.7% | 1.3%(+0.406)#63 | 1.4%(+0.286)#8,364 |
| 64. | 03276 | 1.7% | 1.3%(+0.382)#64 | 1.4%(+0.262)#8,596 |
| 65. | 03048 | 1.7% | 1.3%(+0.365)#65 | 1.4%(+0.245)#8,770 |
| 66. | 03605 | 1.7% | 1.3%(+0.346)#66 | 1.4%(+0.226)#9,006 |
| 67. | 03745 | 1.7% | 1.3%(+0.343)#67 | 1.4%(+0.223)#9,043 |
| 68. | 03450 | 1.7% | 1.3%(+0.342)#68 | 1.4%(+0.222)#9,059 |
| 69. | 03044 | 1.7% | 1.3%(+0.325)#69 | 1.4%(+0.205)#9,254 |
| 70. | 03218 | 1.6% | 1.3%(+0.319)#70 | 1.4%(+0.199)#9,328 |
| 71. | 03840 | 1.6% | 1.3%(+0.287)#71 | 1.4%(+0.167)#9,661 |
| 72. | 03446 | 1.6% | 1.3%(+0.276)#72 | 1.4%(+0.156)#9,800 |
| 73. | 03251 | 1.6% | 1.3%(+0.266)#73 | 1.4%(+0.146)#9,903 |
| 74. | 03801 | 1.6% | 1.3%(+0.265)#74 | 1.4%(+0.145)#9,915 |
| 75. | 03230 | 1.6% | 1.3%(+0.238)#75 | 1.4%(+0.118)#10,198 |
| 76. | 03237 | 1.6% | 1.3%(+0.236)#76 | 1.4%(+0.116)#10,218 |
| 77. | 03038 | 1.5% | 1.3%(+0.204)#77 | 1.4%(+0.084)#10,617 |
| 78. | 03079 | 1.5% | 1.3%(+0.203)#78 | 1.4%(+0.083)#10,625 |
| 79. | 03261 | 1.5% | 1.3%(+0.201)#79 | 1.4%(+0.081)#10,652 |
| 80. | 03244 | 1.5% | 1.3%(+0.190)#80 | 1.4%(+0.070)#10,762 |
| 81. | 03849 | 1.5% | 1.3%(+0.178)#81 | 1.4%(+0.058)#10,912 |
| 82. | 03049 | 1.5% | 1.3%(+0.155)#82 | 1.4%(+0.036)#11,196 |
| 83. | 03052 | 1.5% | 1.3%(+0.149)#83 | 1.4%(+0.029)#11,276 |
| 84. | 03782 | 1.5% | 1.3%(+0.148)#84 | 1.4%(+0.028)#11,292 |
| 85. | 03856 | 1.5% | 1.3%(+0.147)#85 | 1.4%(+0.027)#11,305 |
| 86. | 03827 | 1.5% | 1.3%(+0.146)#86 | 1.4%(+0.026)#11,319 |
| 87. | 03054 | 1.5% | 1.3%(+0.142)#87 | 1.4%(+0.022)#11,366 |
| 88. | 03467 | 1.5% | 1.3%(+0.123)#88 | 1.4%(+0.004)#11,582 |
| 89. | 03464 | 1.4% | 1.3%(+0.120)#89 | 1.4%(-0.000)#11,643 |
| 90. | 03820 | 1.4% | 1.3%(+0.104)#90 | 1.4%(-0.016)#11,840 |
| 91. | 03602 | 1.4% | 1.3%(+0.098)#91 | 1.4%(-0.022)#11,899 |
| 92. | 03034 | 1.4% | 1.3%(+0.097)#92 | 1.4%(-0.023)#11,918 |
| 93. | 03278 | 1.4% | 1.3%(+0.087)#93 | 1.4%(-0.033)#12,057 |
| 94. | 03883 | 1.4% | 1.3%(+0.083)#94 | 1.4%(-0.037)#12,116 |
| 95. | 03844 | 1.4% | 1.3%(+0.069)#95 | 1.4%(-0.051)#12,293 |
| 96. | 03284 | 1.4% | 1.3%(+0.064)#96 | 1.4%(-0.055)#12,343 |
| 97. | 03031 | 1.4% | 1.3%(+0.059)#97 | 1.4%(-0.061)#12,412 |
| 98. | 03240 | 1.4% | 1.3%(+0.057)#98 | 1.4%(-0.063)#12,428 |
| 99. | 03833 | 1.4% | 1.3%(+0.048)#99 | 1.4%(-0.072)#12,551 |
| 100. | 03060 | 1.4% | 1.3%(+0.039)#100 | 1.4%(-0.081)#12,655 |
Common Questions
What are the Top 10 Zip Codes with the Highest Percentage of Population Enrolled in Nursery / Preschool in New Hampshire?
Top 10 Zip Codes with the Highest Percentage of Population Enrolled in Nursery / Preschool in New Hampshire are:
What zip code has the Highest Percentage of Population Enrolled in Nursery / Preschool in New Hampshire?
03846 has the Highest Percentage of Population Enrolled in Nursery / Preschool in New Hampshire with 7.1%.
What is the Percentage of Population Enrolled in Nursery / Preschool in the State of New Hampshire?
Percentage of Population Enrolled in Nursery / Preschool in New Hampshire is 1.3%.
What is the Percentage of Population Enrolled in Nursery / Preschool in the United States?
Percentage of Population Enrolled in Nursery / Preschool in the United States is 1.4%.