Zip Codes with the Highest Percentage of Population Employed in Farming, Fishing & Forestry in New Hampshire
RELATED REPORTS & OPTIONS
Farming, Fishing & Forestry
New Hampshire
Compare Zip Codes
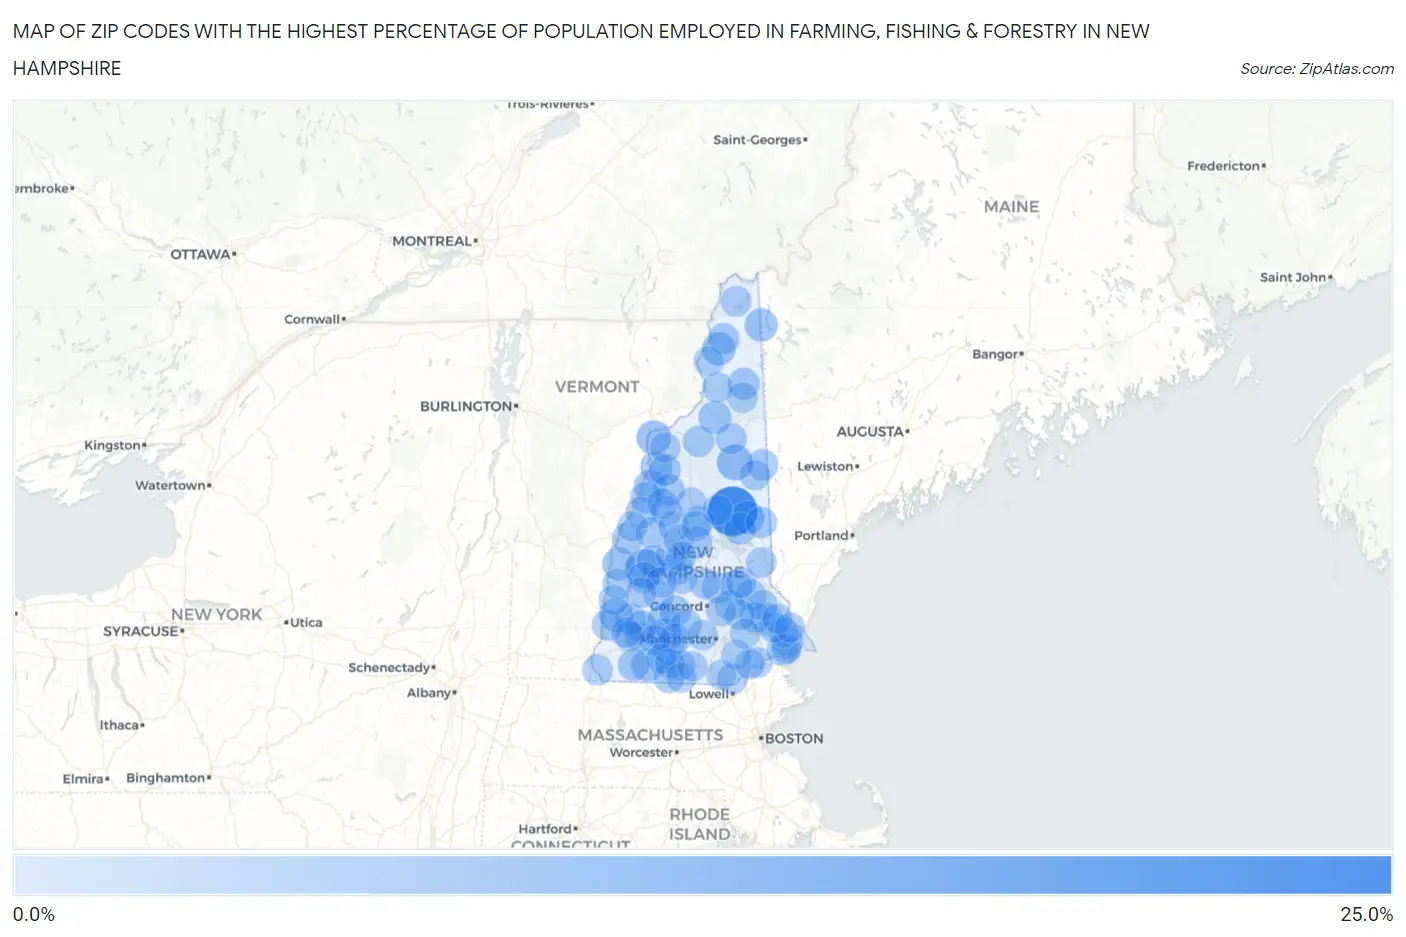
Map of Zip Codes with the Highest Percentage of Population Employed in Farming, Fishing & Forestry in New Hampshire
0.0%
25.0%
Zip Codes with the Highest Percentage of Population Employed in Farming, Fishing & Forestry in New Hampshire
| Zip Code | % Employed | vs State | vs National | |
| 1. | 03883 | 20.6% | 0.32%(+20.3)#1 | 0.61%(+20.0)#378 |
| 2. | 03751 | 9.6% | 0.32%(+9.32)#2 | 0.61%(+9.03)#1,265 |
| 3. | 03812 | 6.0% | 0.32%(+5.70)#3 | 0.61%(+5.41)#2,382 |
| 4. | 03771 | 4.6% | 0.32%(+4.26)#4 | 0.61%(+3.98)#3,238 |
| 5. | 03602 | 4.1% | 0.32%(+3.77)#5 | 0.61%(+3.49)#3,641 |
| 6. | 03597 | 3.6% | 0.32%(+3.26)#6 | 0.61%(+2.98)#4,112 |
| 7. | 03442 | 3.4% | 0.32%(+3.09)#7 | 0.61%(+2.80)#4,318 |
| 8. | 03579 | 3.4% | 0.32%(+3.03)#8 | 0.61%(+2.75)#4,386 |
| 9. | 03814 | 3.3% | 0.32%(+3.02)#9 | 0.61%(+2.73)#4,404 |
| 10. | 03452 | 3.2% | 0.32%(+2.88)#10 | 0.61%(+2.59)#4,551 |
| 11. | 03583 | 3.2% | 0.32%(+2.87)#11 | 0.61%(+2.59)#4,559 |
| 12. | 03745 | 3.0% | 0.32%(+2.70)#12 | 0.61%(+2.42)#4,778 |
| 13. | 03244 | 2.5% | 0.32%(+2.21)#13 | 0.61%(+1.93)#5,492 |
| 14. | 03779 | 2.5% | 0.32%(+2.14)#14 | 0.61%(+1.86)#5,613 |
| 15. | 03256 | 2.4% | 0.32%(+2.05)#15 | 0.61%(+1.76)#5,788 |
| 16. | 03774 | 2.3% | 0.32%(+2.00)#16 | 0.61%(+1.71)#5,886 |
| 17. | 03047 | 2.3% | 0.32%(+1.94)#17 | 0.61%(+1.65)#6,004 |
| 18. | 03816 | 2.2% | 0.32%(+1.85)#18 | 0.61%(+1.57)#6,181 |
| 19. | 03588 | 2.2% | 0.32%(+1.83)#19 | 0.61%(+1.55)#6,222 |
| 20. | 03218 | 2.0% | 0.32%(+1.67)#20 | 0.61%(+1.39)#6,581 |
| 21. | 03216 | 1.9% | 0.32%(+1.61)#21 | 0.61%(+1.32)#6,717 |
| 22. | 03465 | 1.8% | 0.32%(+1.52)#22 | 0.61%(+1.23)#6,921 |
| 23. | 03279 | 1.8% | 0.32%(+1.46)#23 | 0.61%(+1.18)#7,083 |
| 24. | 03777 | 1.8% | 0.32%(+1.45)#24 | 0.61%(+1.16)#7,120 |
| 25. | 03785 | 1.7% | 0.32%(+1.41)#25 | 0.61%(+1.12)#7,218 |
| 26. | 03861 | 1.7% | 0.32%(+1.35)#26 | 0.61%(+1.06)#7,373 |
| 27. | 03766 | 1.7% | 0.32%(+1.34)#27 | 0.61%(+1.05)#7,415 |
| 28. | 03456 | 1.6% | 0.32%(+1.32)#28 | 0.61%(+1.04)#7,454 |
| 29. | 03813 | 1.6% | 0.32%(+1.31)#29 | 0.61%(+1.03)#7,481 |
| 30. | 03307 | 1.6% | 0.32%(+1.30)#30 | 0.61%(+1.02)#7,521 |
| 31. | 03284 | 1.6% | 0.32%(+1.26)#31 | 0.61%(+0.971)#7,659 |
| 32. | 03576 | 1.5% | 0.32%(+1.21)#32 | 0.61%(+0.929)#7,786 |
| 33. | 03882 | 1.5% | 0.32%(+1.21)#33 | 0.61%(+0.928)#7,791 |
| 34. | 03574 | 1.5% | 0.32%(+1.21)#34 | 0.61%(+0.922)#7,808 |
| 35. | 03782 | 1.5% | 0.32%(+1.18)#35 | 0.61%(+0.900)#7,866 |
| 36. | 03464 | 1.5% | 0.32%(+1.17)#36 | 0.61%(+0.890)#7,897 |
| 37. | 03768 | 1.5% | 0.32%(+1.15)#37 | 0.61%(+0.870)#7,954 |
| 38. | 03862 | 1.5% | 0.32%(+1.14)#38 | 0.61%(+0.857)#8,001 |
| 39. | 03242 | 1.5% | 0.32%(+1.14)#39 | 0.61%(+0.853)#8,012 |
| 40. | 03844 | 1.4% | 0.32%(+1.09)#40 | 0.61%(+0.810)#8,160 |
| 41. | 03266 | 1.3% | 0.32%(+0.988)#41 | 0.61%(+0.703)#8,536 |
| 42. | 03593 | 1.3% | 0.32%(+0.983)#42 | 0.61%(+0.699)#8,557 |
| 43. | 03884 | 1.2% | 0.32%(+0.927)#43 | 0.61%(+0.643)#8,765 |
| 44. | 03741 | 1.2% | 0.32%(+0.907)#44 | 0.61%(+0.622)#8,837 |
| 45. | 03608 | 1.2% | 0.32%(+0.874)#45 | 0.61%(+0.590)#8,948 |
| 46. | 03281 | 1.1% | 0.32%(+0.779)#46 | 0.61%(+0.495)#9,313 |
| 47. | 03290 | 1.1% | 0.32%(+0.756)#47 | 0.61%(+0.471)#9,413 |
| 48. | 03071 | 1.1% | 0.32%(+0.747)#48 | 0.61%(+0.462)#9,449 |
| 49. | 03043 | 1.0% | 0.32%(+0.698)#49 | 0.61%(+0.413)#9,653 |
| 50. | 03245 | 0.97% | 0.32%(+0.648)#50 | 0.61%(+0.364)#9,882 |
| 51. | 03241 | 0.94% | 0.32%(+0.617)#51 | 0.61%(+0.333)#10,056 |
| 52. | 03230 | 0.85% | 0.32%(+0.525)#52 | 0.61%(+0.241)#10,533 |
| 53. | 03865 | 0.84% | 0.32%(+0.522)#53 | 0.61%(+0.237)#10,551 |
| 54. | 03221 | 0.77% | 0.32%(+0.454)#54 | 0.61%(+0.169)#10,936 |
| 55. | 03842 | 0.76% | 0.32%(+0.442)#55 | 0.61%(+0.157)#11,002 |
| 56. | 03582 | 0.76% | 0.32%(+0.441)#56 | 0.61%(+0.156)#11,009 |
| 57. | 03282 | 0.75% | 0.32%(+0.434)#57 | 0.61%(+0.149)#11,052 |
| 58. | 03449 | 0.75% | 0.32%(+0.425)#58 | 0.61%(+0.141)#11,092 |
| 59. | 03234 | 0.74% | 0.32%(+0.414)#59 | 0.61%(+0.130)#11,161 |
| 60. | 03451 | 0.71% | 0.32%(+0.391)#60 | 0.61%(+0.106)#11,301 |
| 61. | 03260 | 0.69% | 0.32%(+0.371)#61 | 0.61%(+0.086)#11,431 |
| 62. | 03570 | 0.65% | 0.32%(+0.328)#62 | 0.61%(+0.044)#11,698 |
| 63. | 03224 | 0.65% | 0.32%(+0.328)#63 | 0.61%(+0.043)#11,701 |
| 64. | 03592 | 0.64% | 0.32%(+0.323)#64 | 0.61%(+0.038)#11,738 |
| 65. | 03222 | 0.62% | 0.32%(+0.299)#65 | 0.61%(+0.014)#11,887 |
| 66. | 03860 | 0.62% | 0.32%(+0.294)#66 | 0.61%(+0.010)#11,916 |
| 67. | 03076 | 0.60% | 0.32%(+0.282)#67 | 0.61%(-0.002)#12,013 |
| 68. | 03086 | 0.60% | 0.32%(+0.277)#68 | 0.61%(-0.007)#12,049 |
| 69. | 03225 | 0.59% | 0.32%(+0.269)#69 | 0.61%(-0.016)#12,121 |
| 70. | 03585 | 0.57% | 0.32%(+0.251)#70 | 0.61%(-0.034)#12,277 |
| 71. | 03887 | 0.57% | 0.32%(+0.246)#71 | 0.61%(-0.038)#12,324 |
| 72. | 03268 | 0.55% | 0.32%(+0.232)#72 | 0.61%(-0.052)#12,430 |
| 73. | 03458 | 0.53% | 0.32%(+0.213)#73 | 0.61%(-0.072)#12,571 |
| 74. | 03457 | 0.51% | 0.32%(+0.193)#74 | 0.61%(-0.091)#12,720 |
| 75. | 03445 | 0.49% | 0.32%(+0.164)#75 | 0.61%(-0.120)#12,977 |
| 76. | 03840 | 0.48% | 0.32%(+0.158)#76 | 0.61%(-0.127)#13,040 |
| 77. | 03857 | 0.47% | 0.32%(+0.146)#77 | 0.61%(-0.138)#13,125 |
| 78. | 03743 | 0.47% | 0.32%(+0.145)#78 | 0.61%(-0.139)#13,131 |
| 79. | 03752 | 0.46% | 0.32%(+0.141)#79 | 0.61%(-0.144)#13,166 |
| 80. | 03084 | 0.46% | 0.32%(+0.134)#80 | 0.61%(-0.150)#13,242 |
| 81. | 03048 | 0.45% | 0.32%(+0.127)#81 | 0.61%(-0.158)#13,310 |
| 82. | 03603 | 0.44% | 0.32%(+0.117)#82 | 0.61%(-0.167)#13,403 |
| 83. | 03045 | 0.43% | 0.32%(+0.113)#83 | 0.61%(-0.171)#13,452 |
| 84. | 03755 | 0.43% | 0.32%(+0.111)#84 | 0.61%(-0.174)#13,484 |
| 85. | 03590 | 0.43% | 0.32%(+0.104)#85 | 0.61%(-0.180)#13,540 |
| 86. | 03825 | 0.42% | 0.32%(+0.099)#86 | 0.61%(-0.186)#13,586 |
| 87. | 03223 | 0.41% | 0.32%(+0.091)#87 | 0.61%(-0.193)#13,655 |
| 88. | 03448 | 0.40% | 0.32%(+0.080)#88 | 0.61%(-0.205)#13,744 |
| 89. | 03227 | 0.39% | 0.32%(+0.073)#89 | 0.61%(-0.211)#13,810 |
| 90. | 03037 | 0.39% | 0.32%(+0.066)#90 | 0.61%(-0.218)#13,875 |
| 91. | 03824 | 0.38% | 0.32%(+0.062)#91 | 0.61%(-0.223)#13,925 |
| 92. | 03051 | 0.38% | 0.32%(+0.058)#92 | 0.61%(-0.227)#13,957 |
| 93. | 03243 | 0.37% | 0.32%(+0.050)#93 | 0.61%(-0.234)#14,036 |
| 94. | 03038 | 0.35% | 0.32%(+0.032)#94 | 0.61%(-0.253)#14,236 |
| 95. | 03055 | 0.34% | 0.32%(+0.018)#95 | 0.61%(-0.267)#14,381 |
| 96. | 03811 | 0.34% | 0.32%(+0.016)#96 | 0.61%(-0.269)#14,403 |
| 97. | 03077 | 0.33% | 0.32%(+0.013)#97 | 0.61%(-0.271)#14,445 |
| 98. | 03275 | 0.33% | 0.32%(+0.007)#98 | 0.61%(-0.278)#14,502 |
| 99. | 03217 | 0.30% | 0.32%(-0.023)#99 | 0.61%(-0.307)#14,857 |
| 100. | 03801 | 0.28% | 0.32%(-0.043)#100 | 0.61%(-0.327)#15,085 |
Common Questions
What are the Top 10 Zip Codes with the Highest Percentage of Population Employed in Farming, Fishing & Forestry in New Hampshire?
Top 10 Zip Codes with the Highest Percentage of Population Employed in Farming, Fishing & Forestry in New Hampshire are:
What zip code has the Highest Percentage of Population Employed in Farming, Fishing & Forestry in New Hampshire?
03883 has the Highest Percentage of Population Employed in Farming, Fishing & Forestry in New Hampshire with 20.6%.
What is the Percentage of Population Employed in Farming, Fishing & Forestry in the State of New Hampshire?
Percentage of Population Employed in Farming, Fishing & Forestry in New Hampshire is 0.32%.
What is the Percentage of Population Employed in Farming, Fishing & Forestry in the United States?
Percentage of Population Employed in Farming, Fishing & Forestry in the United States is 0.61%.