Zip Codes with the Highest Percentage of Population with a Degree in Business in New Hampshire
RELATED REPORTS & OPTIONS
Business
New Hampshire
Compare Zip Codes
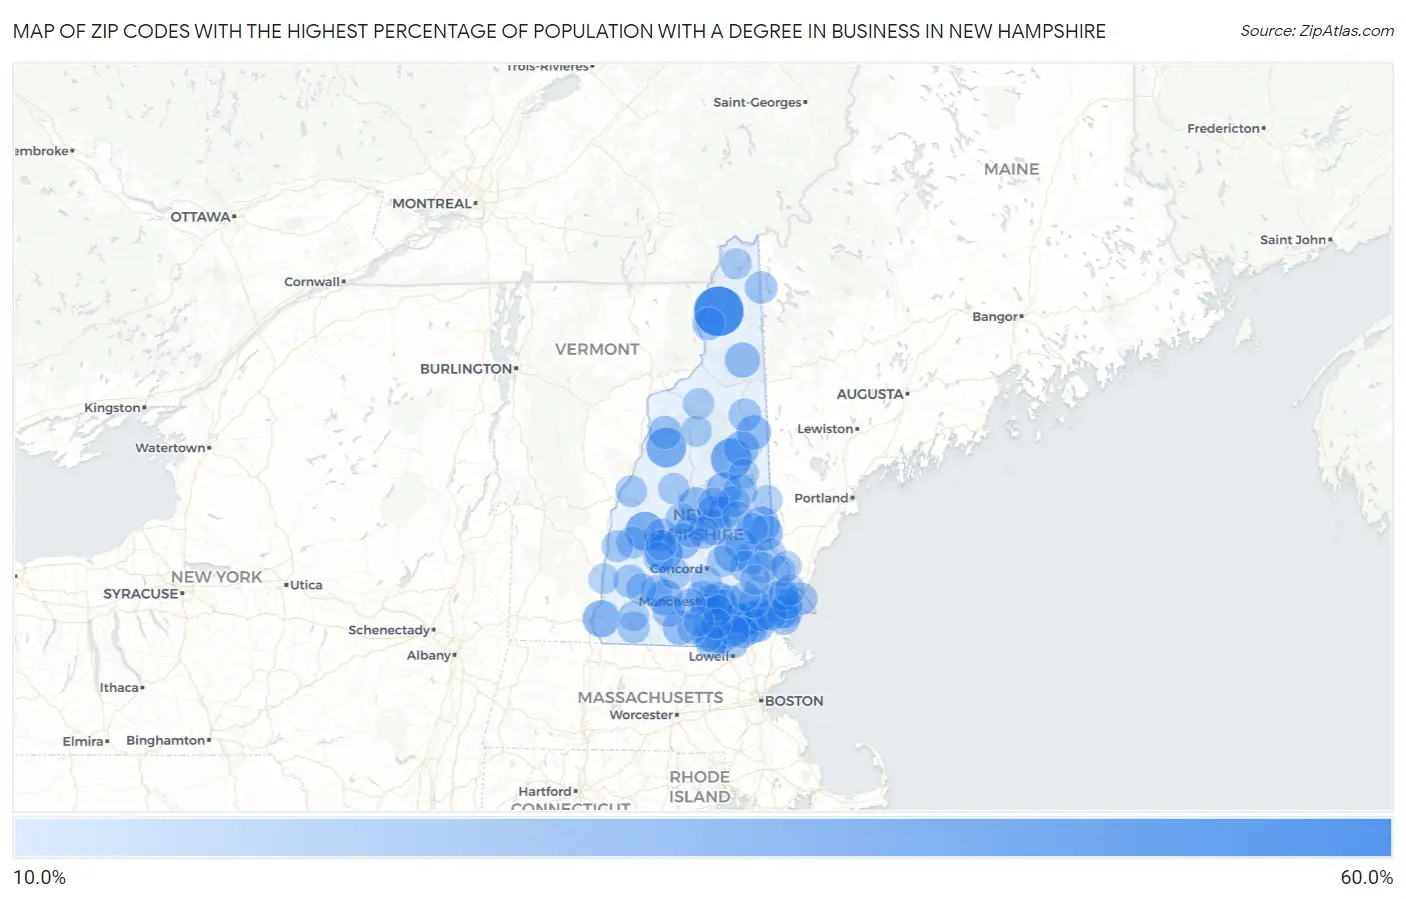
Map of Zip Codes with the Highest Percentage of Population with a Degree in Business in New Hampshire
10.0%
60.0%
Zip Codes with the Highest Percentage of Population with a Degree in Business in New Hampshire
| Zip Code | % Graduates | vs State | vs National | |
| 1. | 03597 | 58.8% | 18.2%(+40.6)#1 | 19.5%(+39.3)#447 |
| 2. | 03897 | 40.0% | 18.2%(+21.8)#2 | 19.5%(+20.5)#1,242 |
| 3. | 03238 | 37.5% | 18.2%(+19.3)#3 | 19.5%(+18.0)#1,438 |
| 4. | 03751 | 36.0% | 18.2%(+17.8)#4 | 19.5%(+16.5)#1,598 |
| 5. | 03273 | 32.9% | 18.2%(+14.6)#5 | 19.5%(+13.4)#2,101 |
| 6. | 03443 | 31.6% | 18.2%(+13.4)#6 | 19.5%(+12.1)#2,361 |
| 7. | 03887 | 31.0% | 18.2%(+12.8)#7 | 19.5%(+11.5)#2,509 |
| 8. | 03263 | 29.4% | 18.2%(+11.2)#8 | 19.5%(+9.88)#3,063 |
| 9. | 03811 | 29.0% | 18.2%(+10.8)#9 | 19.5%(+9.53)#3,201 |
| 10. | 03442 | 28.9% | 18.2%(+10.7)#10 | 19.5%(+9.40)#3,246 |
| 11. | 03885 | 28.8% | 18.2%(+10.6)#11 | 19.5%(+9.28)#3,300 |
| 12. | 03256 | 28.7% | 18.2%(+10.4)#12 | 19.5%(+9.17)#3,342 |
| 13. | 03851 | 28.6% | 18.2%(+10.4)#13 | 19.5%(+9.07)#3,369 |
| 14. | 03064 | 28.5% | 18.2%(+10.3)#14 | 19.5%(+9.01)#3,432 |
| 15. | 03268 | 28.2% | 18.2%(+10.0)#15 | 19.5%(+8.72)#3,554 |
| 16. | 03220 | 28.2% | 18.2%(+9.96)#16 | 19.5%(+8.67)#3,585 |
| 17. | 03818 | 28.0% | 18.2%(+9.79)#17 | 19.5%(+8.51)#3,675 |
| 18. | 03254 | 28.0% | 18.2%(+9.78)#18 | 19.5%(+8.50)#3,693 |
| 19. | 03570 | 27.7% | 18.2%(+9.49)#19 | 19.5%(+8.20)#3,825 |
| 20. | 03086 | 26.8% | 18.2%(+8.58)#20 | 19.5%(+7.30)#4,319 |
| 21. | 03826 | 26.7% | 18.2%(+8.51)#21 | 19.5%(+7.23)#4,364 |
| 22. | 03032 | 26.5% | 18.2%(+8.24)#22 | 19.5%(+6.96)#4,576 |
| 23. | 03847 | 26.4% | 18.2%(+8.13)#23 | 19.5%(+6.85)#4,643 |
| 24. | 03816 | 25.7% | 18.2%(+7.44)#24 | 19.5%(+6.15)#5,134 |
| 25. | 03865 | 25.6% | 18.2%(+7.38)#25 | 19.5%(+6.10)#5,179 |
| 26. | 03246 | 24.9% | 18.2%(+6.67)#26 | 19.5%(+5.39)#5,791 |
| 27. | 03842 | 24.2% | 18.2%(+5.96)#27 | 19.5%(+4.68)#6,427 |
| 28. | 03785 | 24.0% | 18.2%(+5.83)#28 | 19.5%(+4.55)#6,556 |
| 29. | 03841 | 24.0% | 18.2%(+5.79)#29 | 19.5%(+4.51)#6,586 |
| 30. | 03076 | 24.0% | 18.2%(+5.75)#30 | 19.5%(+4.47)#6,646 |
| 31. | 03045 | 24.0% | 18.2%(+5.74)#31 | 19.5%(+4.46)#6,647 |
| 32. | 03104 | 23.7% | 18.2%(+5.49)#32 | 19.5%(+4.21)#6,897 |
| 33. | 03456 | 23.4% | 18.2%(+5.20)#33 | 19.5%(+3.92)#7,201 |
| 34. | 03884 | 23.4% | 18.2%(+5.15)#34 | 19.5%(+3.87)#7,254 |
| 35. | 03225 | 23.0% | 18.2%(+4.82)#35 | 19.5%(+3.54)#7,625 |
| 36. | 03233 | 22.7% | 18.2%(+4.51)#36 | 19.5%(+3.23)#7,948 |
| 37. | 03235 | 22.7% | 18.2%(+4.50)#37 | 19.5%(+3.22)#7,957 |
| 38. | 03874 | 22.6% | 18.2%(+4.43)#38 | 19.5%(+3.14)#8,036 |
| 39. | 03590 | 22.6% | 18.2%(+4.40)#39 | 19.5%(+3.12)#8,061 |
| 40. | 03110 | 22.6% | 18.2%(+4.39)#40 | 19.5%(+3.11)#8,082 |
| 41. | 03846 | 22.6% | 18.2%(+4.33)#41 | 19.5%(+3.05)#8,144 |
| 42. | 03249 | 22.5% | 18.2%(+4.31)#42 | 19.5%(+3.03)#8,165 |
| 43. | 03051 | 22.5% | 18.2%(+4.26)#43 | 19.5%(+2.98)#8,221 |
| 44. | 03053 | 22.1% | 18.2%(+3.91)#44 | 19.5%(+2.63)#8,631 |
| 45. | 03848 | 22.1% | 18.2%(+3.87)#45 | 19.5%(+2.59)#8,683 |
| 46. | 03579 | 22.0% | 18.2%(+3.73)#46 | 19.5%(+2.45)#8,889 |
| 47. | 03054 | 21.7% | 18.2%(+3.51)#47 | 19.5%(+2.23)#9,176 |
| 48. | 03870 | 21.7% | 18.2%(+3.45)#48 | 19.5%(+2.17)#9,246 |
| 49. | 03773 | 21.6% | 18.2%(+3.40)#49 | 19.5%(+2.12)#9,310 |
| 50. | 03276 | 21.6% | 18.2%(+3.36)#50 | 19.5%(+2.08)#9,367 |
| 51. | 03062 | 21.3% | 18.2%(+3.07)#51 | 19.5%(+1.78)#9,764 |
| 52. | 03440 | 21.3% | 18.2%(+3.04)#52 | 19.5%(+1.76)#9,799 |
| 53. | 03047 | 21.2% | 18.2%(+2.98)#53 | 19.5%(+1.70)#9,890 |
| 54. | 03465 | 21.0% | 18.2%(+2.73)#54 | 19.5%(+1.45)#10,216 |
| 55. | 03102 | 20.9% | 18.2%(+2.73)#55 | 19.5%(+1.45)#10,222 |
| 56. | 03844 | 20.9% | 18.2%(+2.66)#56 | 19.5%(+1.38)#10,319 |
| 57. | 03038 | 20.7% | 18.2%(+2.45)#57 | 19.5%(+1.17)#10,652 |
| 58. | 03079 | 20.7% | 18.2%(+2.44)#58 | 19.5%(+1.16)#10,658 |
| 59. | 03109 | 20.5% | 18.2%(+2.33)#59 | 19.5%(+1.05)#10,818 |
| 60. | 03743 | 20.4% | 18.2%(+2.14)#60 | 19.5%(+0.862)#11,088 |
| 61. | 03750 | 20.3% | 18.2%(+2.07)#61 | 19.5%(+0.786)#11,195 |
| 62. | 03087 | 20.3% | 18.2%(+2.07)#62 | 19.5%(+0.786)#11,196 |
| 63. | 03853 | 20.2% | 18.2%(+2.00)#63 | 19.5%(+0.714)#11,293 |
| 64. | 03243 | 20.0% | 18.2%(+1.78)#64 | 19.5%(+0.501)#11,601 |
| 65. | 03855 | 19.8% | 18.2%(+1.61)#65 | 19.5%(+0.326)#11,876 |
| 66. | 03261 | 19.7% | 18.2%(+1.50)#66 | 19.5%(+0.223)#12,033 |
| 67. | 03241 | 19.7% | 18.2%(+1.45)#67 | 19.5%(+0.169)#12,107 |
| 68. | 03827 | 19.6% | 18.2%(+1.41)#68 | 19.5%(+0.127)#12,170 |
| 69. | 03867 | 19.6% | 18.2%(+1.38)#69 | 19.5%(+0.098)#12,212 |
| 70. | 03242 | 19.6% | 18.2%(+1.35)#70 | 19.5%(+0.071)#12,259 |
| 71. | 03103 | 19.5% | 18.2%(+1.26)#71 | 19.5%(-0.022)#12,402 |
| 72. | 03258 | 19.3% | 18.2%(+1.11)#72 | 19.5%(-0.177)#12,619 |
| 73. | 03063 | 19.3% | 18.2%(+1.05)#73 | 19.5%(-0.235)#12,713 |
| 74. | 03304 | 19.2% | 18.2%(+1.00)#74 | 19.5%(-0.280)#12,792 |
| 75. | 03042 | 19.2% | 18.2%(+0.973)#75 | 19.5%(-0.308)#12,846 |
| 76. | 03070 | 19.2% | 18.2%(+0.958)#76 | 19.5%(-0.324)#12,866 |
| 77. | 03221 | 19.2% | 18.2%(+0.957)#77 | 19.5%(-0.325)#12,867 |
| 78. | 03574 | 19.1% | 18.2%(+0.894)#78 | 19.5%(-0.388)#12,967 |
| 79. | 03044 | 19.1% | 18.2%(+0.886)#79 | 19.5%(-0.396)#12,981 |
| 80. | 03840 | 19.0% | 18.2%(+0.830)#80 | 19.5%(-0.451)#13,049 |
| 81. | 03251 | 19.0% | 18.2%(+0.776)#81 | 19.5%(-0.506)#13,138 |
| 82. | 03820 | 18.9% | 18.2%(+0.724)#82 | 19.5%(-0.557)#13,214 |
| 83. | 03464 | 18.9% | 18.2%(+0.715)#83 | 19.5%(-0.567)#13,231 |
| 84. | 03862 | 18.8% | 18.2%(+0.624)#84 | 19.5%(-0.658)#13,362 |
| 85. | 03592 | 18.8% | 18.2%(+0.623)#85 | 19.5%(-0.658)#13,364 |
| 86. | 03260 | 18.5% | 18.2%(+0.288)#86 | 19.5%(-0.994)#13,857 |
| 87. | 03825 | 18.5% | 18.2%(+0.284)#87 | 19.5%(-0.998)#13,862 |
| 88. | 03801 | 18.5% | 18.2%(+0.248)#88 | 19.5%(-1.03)#13,914 |
| 89. | 03055 | 18.3% | 18.2%(+0.061)#89 | 19.5%(-1.22)#14,176 |
| 90. | 03253 | 18.2% | 18.2%(-0.047)#90 | 19.5%(-1.33)#14,348 |
| 91. | 03869 | 18.2% | 18.2%(-0.048)#91 | 19.5%(-1.33)#14,350 |
| 92. | 03052 | 18.2% | 18.2%(-0.057)#92 | 19.5%(-1.34)#14,361 |
| 93. | 03609 | 17.9% | 18.2%(-0.307)#93 | 19.5%(-1.59)#14,711 |
| 94. | 03810 | 17.9% | 18.2%(-0.344)#94 | 19.5%(-1.63)#14,764 |
| 95. | 03455 | 17.9% | 18.2%(-0.350)#95 | 19.5%(-1.63)#14,771 |
| 96. | 03031 | 17.7% | 18.2%(-0.536)#96 | 19.5%(-1.82)#15,050 |
| 97. | 03890 | 17.6% | 18.2%(-0.570)#97 | 19.5%(-1.85)#15,112 |
| 98. | 03077 | 17.6% | 18.2%(-0.573)#98 | 19.5%(-1.86)#15,117 |
| 99. | 03830 | 17.5% | 18.2%(-0.708)#99 | 19.5%(-1.99)#15,321 |
| 100. | 03290 | 17.4% | 18.2%(-0.836)#100 | 19.5%(-2.12)#15,530 |
Common Questions
What are the Top 10 Zip Codes with the Highest Percentage of Population with a Degree in Business in New Hampshire?
Top 10 Zip Codes with the Highest Percentage of Population with a Degree in Business in New Hampshire are:
What zip code has the Highest Percentage of Population with a Degree in Business in New Hampshire?
03597 has the Highest Percentage of Population with a Degree in Business in New Hampshire with 58.8%.
What is the Percentage of Population with a Degree in Business in the State of New Hampshire?
Percentage of Population with a Degree in Business in New Hampshire is 18.2%.
What is the Percentage of Population with a Degree in Business in the United States?
Percentage of Population with a Degree in Business in the United States is 19.5%.