Zip Codes with the Highest Percentage of Population Employed in Firefighting & Prevention in New Hampshire
RELATED REPORTS & OPTIONS
Firefighting & Prevention
New Hampshire
Compare Zip Codes
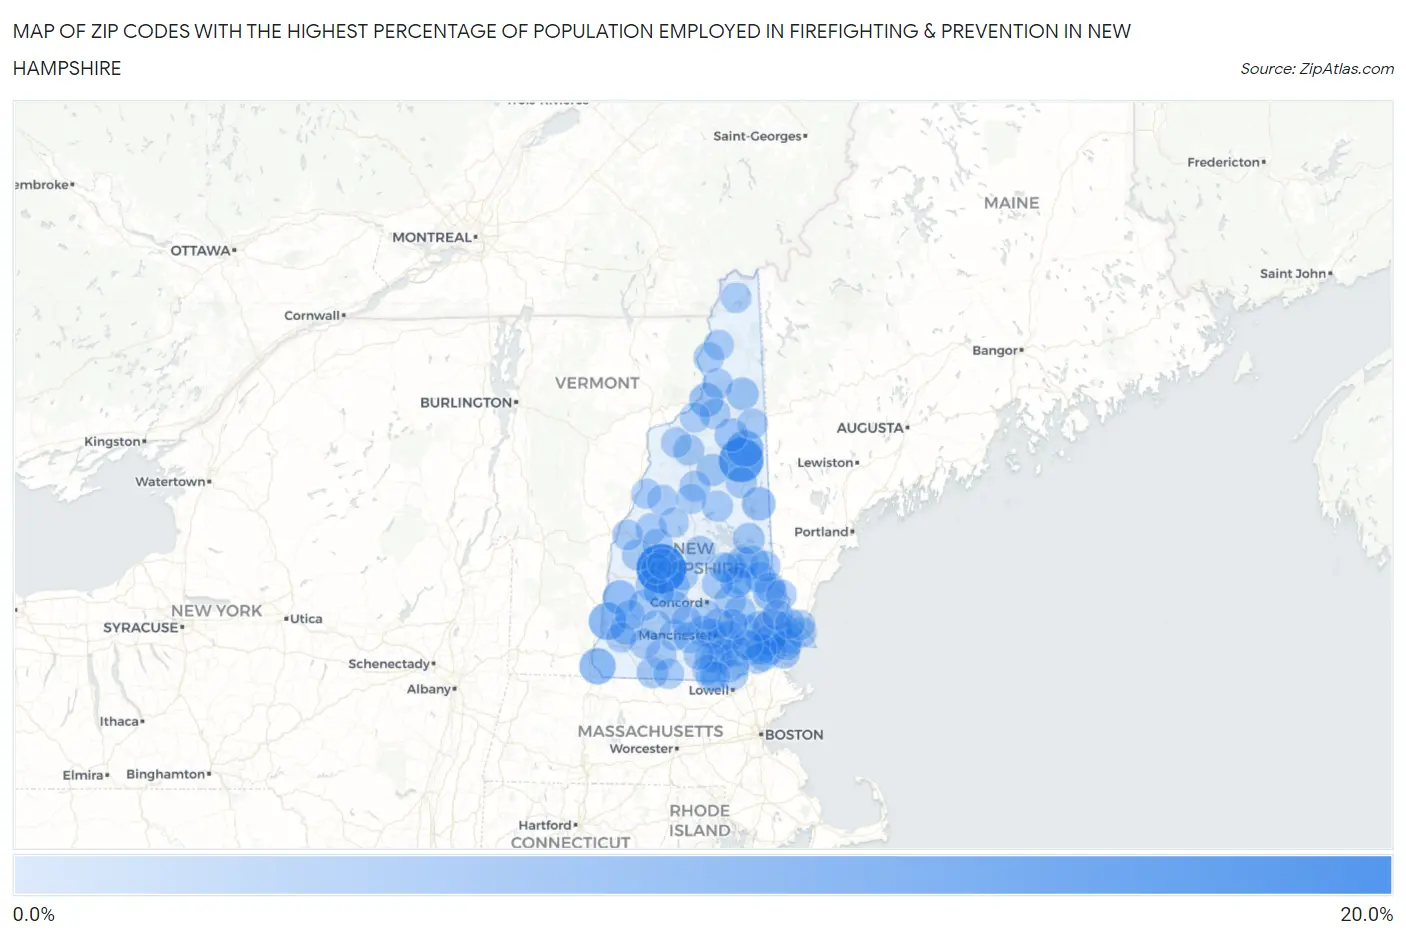
Map of Zip Codes with the Highest Percentage of Population Employed in Firefighting & Prevention in New Hampshire
0.0%
20.0%
Zip Codes with the Highest Percentage of Population Employed in Firefighting & Prevention in New Hampshire
| Zip Code | % Employed | vs State | vs National | |
| 1. | 03233 | 19.7% | 0.89%(+18.9)#1 | 1.2%(+18.6)#99 |
| 2. | 03838 | 14.7% | 0.89%(+13.8)#2 | 1.2%(+13.5)#164 |
| 3. | 03856 | 9.7% | 0.89%(+8.83)#3 | 1.2%(+8.53)#315 |
| 4. | 03608 | 7.7% | 0.89%(+6.78)#4 | 1.2%(+6.48)#446 |
| 5. | 03846 | 7.0% | 0.89%(+6.13)#5 | 1.2%(+5.84)#510 |
| 6. | 03451 | 6.5% | 0.89%(+5.66)#6 | 1.2%(+5.36)#585 |
| 7. | 03601 | 4.8% | 0.89%(+3.90)#7 | 1.2%(+3.60)#995 |
| 8. | 03584 | 4.4% | 0.89%(+3.46)#8 | 1.2%(+3.16)#1,174 |
| 9. | 03839 | 4.0% | 0.89%(+3.12)#9 | 1.2%(+2.82)#1,355 |
| 10. | 03836 | 3.9% | 0.89%(+3.04)#10 | 1.2%(+2.74)#1,398 |
| 11. | 03855 | 3.7% | 0.89%(+2.86)#11 | 1.2%(+2.56)#1,509 |
| 12. | 03593 | 3.5% | 0.89%(+2.59)#12 | 1.2%(+2.29)#1,738 |
| 13. | 03109 | 3.2% | 0.89%(+2.27)#13 | 1.2%(+1.97)#2,065 |
| 14. | 03570 | 2.8% | 0.89%(+1.89)#14 | 1.2%(+1.59)#2,601 |
| 15. | 03874 | 2.8% | 0.89%(+1.87)#15 | 1.2%(+1.58)#2,628 |
| 16. | 03242 | 2.7% | 0.89%(+1.79)#16 | 1.2%(+1.49)#2,766 |
| 17. | 03837 | 2.6% | 0.89%(+1.69)#17 | 1.2%(+1.39)#2,945 |
| 18. | 03819 | 2.6% | 0.89%(+1.67)#18 | 1.2%(+1.37)#2,973 |
| 19. | 03215 | 2.5% | 0.89%(+1.59)#19 | 1.2%(+1.29)#3,143 |
| 20. | 03448 | 2.2% | 0.89%(+1.32)#20 | 1.2%(+1.02)#3,848 |
| 21. | 03225 | 2.2% | 0.89%(+1.29)#21 | 1.2%(+0.997)#3,926 |
| 22. | 03809 | 2.1% | 0.89%(+1.20)#22 | 1.2%(+0.907)#4,170 |
| 23. | 03461 | 2.0% | 0.89%(+1.14)#23 | 1.2%(+0.842)#4,411 |
| 24. | 03894 | 2.0% | 0.89%(+1.13)#24 | 1.2%(+0.832)#4,451 |
| 25. | 03827 | 2.0% | 0.89%(+1.11)#25 | 1.2%(+0.814)#4,507 |
| 26. | 03077 | 1.9% | 0.89%(+1.02)#26 | 1.2%(+0.719)#4,906 |
| 27. | 03835 | 1.9% | 0.89%(+1.01)#27 | 1.2%(+0.715)#4,919 |
| 28. | 03858 | 1.9% | 0.89%(+0.995)#28 | 1.2%(+0.698)#4,983 |
| 29. | 03234 | 1.9% | 0.89%(+0.991)#29 | 1.2%(+0.693)#5,007 |
| 30. | 03255 | 1.9% | 0.89%(+0.978)#30 | 1.2%(+0.680)#5,063 |
| 31. | 03037 | 1.9% | 0.89%(+0.971)#31 | 1.2%(+0.674)#5,091 |
| 32. | 03862 | 1.8% | 0.89%(+0.884)#32 | 1.2%(+0.586)#5,487 |
| 33. | 03833 | 1.8% | 0.89%(+0.874)#33 | 1.2%(+0.577)#5,528 |
| 34. | 03218 | 1.8% | 0.89%(+0.868)#34 | 1.2%(+0.571)#5,558 |
| 35. | 03052 | 1.7% | 0.89%(+0.839)#35 | 1.2%(+0.542)#5,697 |
| 36. | 03070 | 1.7% | 0.89%(+0.838)#36 | 1.2%(+0.540)#5,708 |
| 37. | 03818 | 1.7% | 0.89%(+0.833)#37 | 1.2%(+0.536)#5,728 |
| 38. | 03043 | 1.6% | 0.89%(+0.713)#38 | 1.2%(+0.415)#6,384 |
| 39. | 03278 | 1.6% | 0.89%(+0.664)#39 | 1.2%(+0.367)#6,638 |
| 40. | 03268 | 1.5% | 0.89%(+0.633)#40 | 1.2%(+0.336)#6,840 |
| 41. | 03753 | 1.5% | 0.89%(+0.612)#41 | 1.2%(+0.315)#6,964 |
| 42. | 03580 | 1.5% | 0.89%(+0.609)#42 | 1.2%(+0.312)#6,987 |
| 43. | 03032 | 1.5% | 0.89%(+0.608)#43 | 1.2%(+0.311)#6,997 |
| 44. | 03038 | 1.5% | 0.89%(+0.586)#44 | 1.2%(+0.289)#7,142 |
| 45. | 03227 | 1.4% | 0.89%(+0.557)#45 | 1.2%(+0.260)#7,345 |
| 46. | 03053 | 1.4% | 0.89%(+0.541)#46 | 1.2%(+0.243)#7,442 |
| 47. | 03842 | 1.4% | 0.89%(+0.530)#47 | 1.2%(+0.233)#7,508 |
| 48. | 03851 | 1.4% | 0.89%(+0.512)#48 | 1.2%(+0.214)#7,644 |
| 49. | 03285 | 1.4% | 0.89%(+0.507)#49 | 1.2%(+0.210)#7,673 |
| 50. | 03307 | 1.3% | 0.89%(+0.445)#50 | 1.2%(+0.148)#8,102 |
| 51. | 03269 | 1.3% | 0.89%(+0.445)#51 | 1.2%(+0.148)#8,103 |
| 52. | 03848 | 1.3% | 0.89%(+0.444)#52 | 1.2%(+0.146)#8,113 |
| 53. | 03741 | 1.3% | 0.89%(+0.430)#53 | 1.2%(+0.133)#8,207 |
| 54. | 03280 | 1.3% | 0.89%(+0.389)#54 | 1.2%(+0.092)#8,520 |
| 55. | 03867 | 1.2% | 0.89%(+0.360)#55 | 1.2%(+0.063)#8,756 |
| 56. | 03582 | 1.2% | 0.89%(+0.308)#56 | 1.2%(+0.011)#9,172 |
| 57. | 03045 | 1.2% | 0.89%(+0.303)#57 | 1.2%(+0.006)#9,214 |
| 58. | 03458 | 1.2% | 0.89%(+0.286)#58 | 1.2%(-0.012)#9,374 |
| 59. | 03221 | 1.2% | 0.89%(+0.273)#59 | 1.2%(-0.024)#9,490 |
| 60. | 03240 | 1.2% | 0.89%(+0.272)#60 | 1.2%(-0.025)#9,498 |
| 61. | 03766 | 1.2% | 0.89%(+0.268)#61 | 1.2%(-0.029)#9,537 |
| 62. | 03878 | 1.1% | 0.89%(+0.261)#62 | 1.2%(-0.036)#9,623 |
| 63. | 03257 | 1.1% | 0.89%(+0.246)#63 | 1.2%(-0.051)#9,778 |
| 64. | 03042 | 1.1% | 0.89%(+0.219)#64 | 1.2%(-0.078)#10,043 |
| 65. | 03076 | 1.1% | 0.89%(+0.205)#65 | 1.2%(-0.093)#10,169 |
| 66. | 03071 | 1.1% | 0.89%(+0.179)#66 | 1.2%(-0.118)#10,401 |
| 67. | 03590 | 1.1% | 0.89%(+0.175)#67 | 1.2%(-0.122)#10,441 |
| 68. | 03583 | 1.1% | 0.89%(+0.175)#68 | 1.2%(-0.122)#10,442 |
| 69. | 03824 | 1.0% | 0.89%(+0.150)#69 | 1.2%(-0.147)#10,694 |
| 70. | 03581 | 1.0% | 0.89%(+0.139)#70 | 1.2%(-0.158)#10,805 |
| 71. | 03106 | 1.0% | 0.89%(+0.112)#71 | 1.2%(-0.185)#11,089 |
| 72. | 03870 | 0.97% | 0.89%(+0.077)#72 | 1.2%(-0.220)#11,467 |
| 73. | 03102 | 0.96% | 0.89%(+0.075)#73 | 1.2%(-0.222)#11,486 |
| 74. | 03062 | 0.95% | 0.89%(+0.066)#74 | 1.2%(-0.231)#11,594 |
| 75. | 03282 | 0.94% | 0.89%(+0.055)#75 | 1.2%(-0.242)#11,711 |
| 76. | 03054 | 0.94% | 0.89%(+0.048)#76 | 1.2%(-0.250)#11,775 |
| 77. | 03586 | 0.93% | 0.89%(+0.040)#77 | 1.2%(-0.257)#11,856 |
| 78. | 03281 | 0.92% | 0.89%(+0.032)#78 | 1.2%(-0.266)#11,947 |
| 79. | 03287 | 0.87% | 0.89%(-0.015)#79 | 1.2%(-0.312)#12,434 |
| 80. | 03450 | 0.87% | 0.89%(-0.019)#80 | 1.2%(-0.316)#12,481 |
| 81. | 03592 | 0.86% | 0.89%(-0.030)#81 | 1.2%(-0.327)#12,590 |
| 82. | 03063 | 0.84% | 0.89%(-0.050)#82 | 1.2%(-0.348)#12,789 |
| 83. | 03456 | 0.82% | 0.89%(-0.067)#83 | 1.2%(-0.364)#12,942 |
| 84. | 03854 | 0.80% | 0.89%(-0.086)#84 | 1.2%(-0.384)#13,189 |
| 85. | 03304 | 0.80% | 0.89%(-0.088)#85 | 1.2%(-0.385)#13,209 |
| 86. | 03801 | 0.80% | 0.89%(-0.091)#86 | 1.2%(-0.388)#13,242 |
| 87. | 03223 | 0.78% | 0.89%(-0.110)#87 | 1.2%(-0.407)#13,452 |
| 88. | 03865 | 0.78% | 0.89%(-0.112)#88 | 1.2%(-0.409)#13,472 |
| 89. | 03241 | 0.75% | 0.89%(-0.138)#89 | 1.2%(-0.435)#13,755 |
| 90. | 03087 | 0.75% | 0.89%(-0.143)#90 | 1.2%(-0.440)#13,817 |
| 91. | 03597 | 0.72% | 0.89%(-0.172)#91 | 1.2%(-0.469)#14,139 |
| 92. | 03060 | 0.71% | 0.89%(-0.179)#92 | 1.2%(-0.476)#14,224 |
| 93. | 03873 | 0.71% | 0.89%(-0.182)#93 | 1.2%(-0.479)#14,247 |
| 94. | 03440 | 0.71% | 0.89%(-0.183)#94 | 1.2%(-0.481)#14,271 |
| 95. | 03777 | 0.68% | 0.89%(-0.208)#95 | 1.2%(-0.506)#14,566 |
| 96. | 03431 | 0.67% | 0.89%(-0.219)#96 | 1.2%(-0.517)#14,675 |
| 97. | 03237 | 0.66% | 0.89%(-0.231)#97 | 1.2%(-0.528)#14,820 |
| 98. | 03598 | 0.65% | 0.89%(-0.234)#98 | 1.2%(-0.531)#14,847 |
| 99. | 03031 | 0.65% | 0.89%(-0.236)#99 | 1.2%(-0.533)#14,871 |
| 100. | 03034 | 0.64% | 0.89%(-0.246)#100 | 1.2%(-0.544)#14,985 |
Common Questions
What are the Top 10 Zip Codes with the Highest Percentage of Population Employed in Firefighting & Prevention in New Hampshire?
Top 10 Zip Codes with the Highest Percentage of Population Employed in Firefighting & Prevention in New Hampshire are:
What zip code has the Highest Percentage of Population Employed in Firefighting & Prevention in New Hampshire?
03233 has the Highest Percentage of Population Employed in Firefighting & Prevention in New Hampshire with 19.7%.
What is the Percentage of Population Employed in Firefighting & Prevention in the State of New Hampshire?
Percentage of Population Employed in Firefighting & Prevention in New Hampshire is 0.89%.
What is the Percentage of Population Employed in Firefighting & Prevention in the United States?
Percentage of Population Employed in Firefighting & Prevention in the United States is 1.2%.