Zip Codes with the Highest Percentage of Hawaiian / Pacific Population in Missoula, MT
RELATED REPORTS & OPTIONS
Hawaiian / Pacific
Missoula
Compare Zip Codes
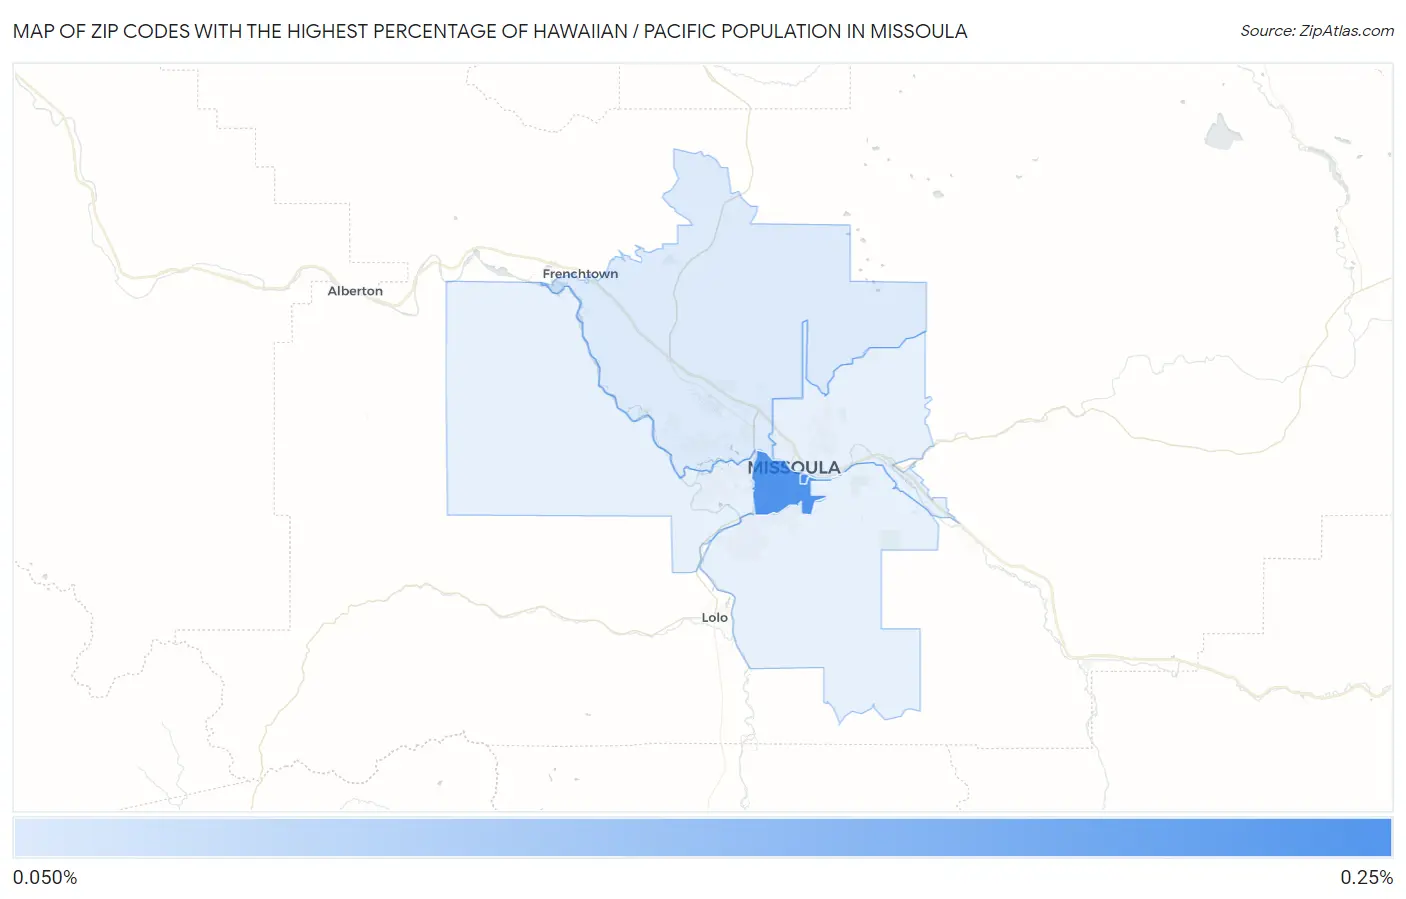
Map of Zip Codes with the Highest Percentage of Hawaiian / Pacific Population in Missoula
0.079%
0.23%
Zip Codes with the Highest Percentage of Hawaiian / Pacific Population in Missoula, MT
| Zip Code | Hawaiian / Pacific | vs State | vs National | |
| 1. | 59812 | 0.23% | 0.062%(+0.165)#15 | 0.19%(+0.039)#2,584 |
| 2. | 59801 | 0.22% | 0.062%(+0.156)#17 | 0.19%(+0.030)#2,654 |
| 3. | 59808 | 0.079% | 0.062%(+0.016)#22 | 0.19%(-0.110)#4,449 |
1
Common Questions
What are the Top 5 Zip Codes with the Highest Percentage of Hawaiian / Pacific Population in Missoula, MT?
Top 5 Zip Codes with the Highest Percentage of Hawaiian / Pacific Population in Missoula, MT are:
What zip code has the Highest Percentage of Hawaiian / Pacific Population in Missoula, MT?
59812 has the Highest Percentage of Hawaiian / Pacific Population in Missoula, MT with 0.23%.
What is the Percentage of Hawaiian / Pacific Population in Missoula, MT?
Percentage of Hawaiian / Pacific Population in Missoula is 0.12%.
What is the Percentage of Hawaiian / Pacific Population in Montana?
Percentage of Hawaiian / Pacific Population in Montana is 0.062%.
What is the Percentage of Hawaiian / Pacific Population in the United States?
Percentage of Hawaiian / Pacific Population in the United States is 0.19%.