Zip Codes with the Highest Percentage of Hawaiian / Pacific Population in Great Falls, MT
RELATED REPORTS & OPTIONS
Hawaiian / Pacific
Great Falls
Compare Zip Codes
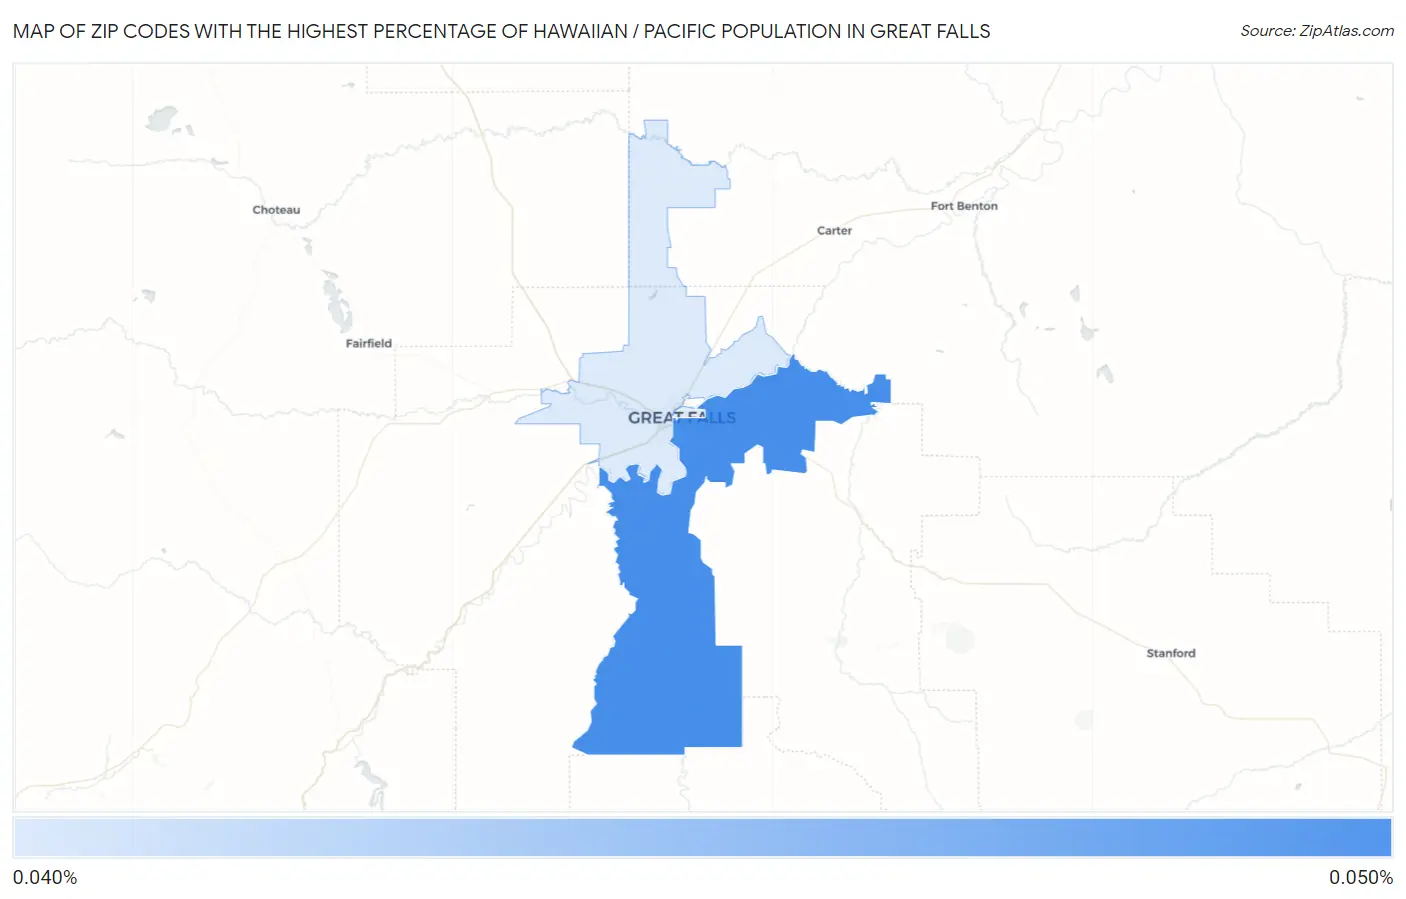
Map of Zip Codes with the Highest Percentage of Hawaiian / Pacific Population in Great Falls
0.042%
0.044%
Zip Codes with the Highest Percentage of Hawaiian / Pacific Population in Great Falls, MT
| Zip Code | Hawaiian / Pacific | vs State | vs National | |
| 1. | 59405 | 0.044% | 0.062%(-0.018)#25 | 0.19%(-0.145)#5,229 |
| 2. | 59404 | 0.042% | 0.062%(-0.020)#26 | 0.19%(-0.146)#5,285 |
1
Common Questions
What are the Top Zip Codes with the Highest Percentage of Hawaiian / Pacific Population in Great Falls, MT?
Top Zip Codes with the Highest Percentage of Hawaiian / Pacific Population in Great Falls, MT are:
What zip code has the Highest Percentage of Hawaiian / Pacific Population in Great Falls, MT?
59405 has the Highest Percentage of Hawaiian / Pacific Population in Great Falls, MT with 0.044%.
What is the Percentage of Hawaiian / Pacific Population in Great Falls, MT?
Percentage of Hawaiian / Pacific Population in Great Falls is 0.0033%.
What is the Percentage of Hawaiian / Pacific Population in Montana?
Percentage of Hawaiian / Pacific Population in Montana is 0.062%.
What is the Percentage of Hawaiian / Pacific Population in the United States?
Percentage of Hawaiian / Pacific Population in the United States is 0.19%.