Zip Codes with the Highest Percentage of Hawaiian / Pacific Population in Billings, MT
RELATED REPORTS & OPTIONS
Hawaiian / Pacific
Billings
Compare Zip Codes
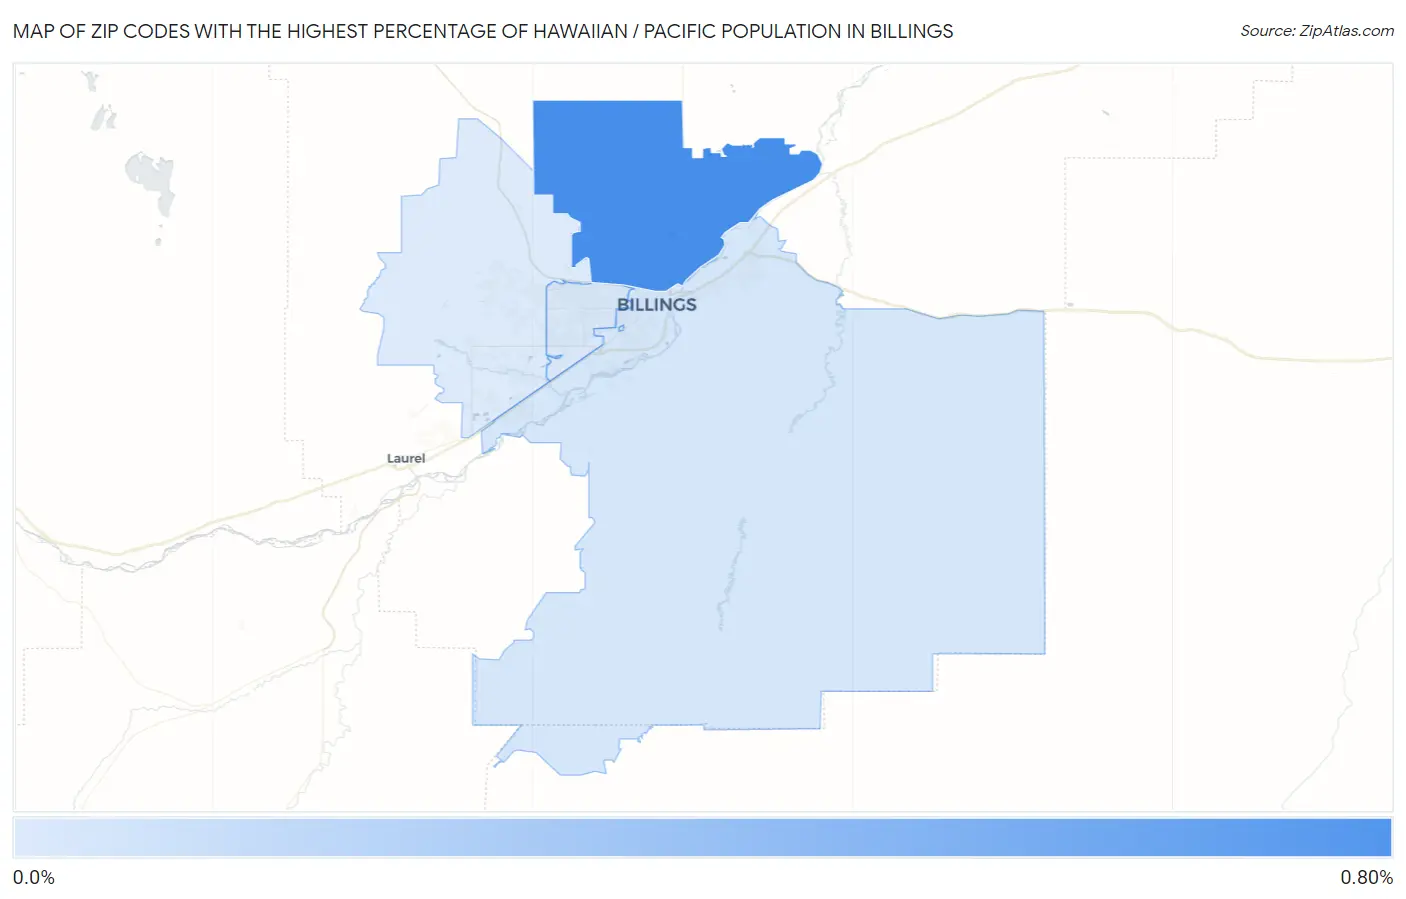
Map of Zip Codes with the Highest Percentage of Hawaiian / Pacific Population in Billings
0.0052%
0.61%
Zip Codes with the Highest Percentage of Hawaiian / Pacific Population in Billings, MT
| Zip Code | Hawaiian / Pacific | vs State | vs National | |
| 1. | 59105 | 0.61% | 0.062%(+0.548)#8 | 0.19%(+0.422)#1,203 |
| 2. | 59101 | 0.032% | 0.062%(-0.031)#28 | 0.19%(-0.157)#5,587 |
| 3. | 59102 | 0.021% | 0.062%(-0.042)#31 | 0.19%(-0.168)#5,972 |
| 4. | 59106 | 0.0052% | 0.062%(-0.057)#35 | 0.19%(-0.183)#6,390 |
1
Common Questions
What are the Top 3 Zip Codes with the Highest Percentage of Hawaiian / Pacific Population in Billings, MT?
Top 3 Zip Codes with the Highest Percentage of Hawaiian / Pacific Population in Billings, MT are:
What zip code has the Highest Percentage of Hawaiian / Pacific Population in Billings, MT?
59105 has the Highest Percentage of Hawaiian / Pacific Population in Billings, MT with 0.61%.
What is the Percentage of Hawaiian / Pacific Population in Billings, MT?
Percentage of Hawaiian / Pacific Population in Billings is 0.18%.
What is the Percentage of Hawaiian / Pacific Population in Montana?
Percentage of Hawaiian / Pacific Population in Montana is 0.062%.
What is the Percentage of Hawaiian / Pacific Population in the United States?
Percentage of Hawaiian / Pacific Population in the United States is 0.19%.