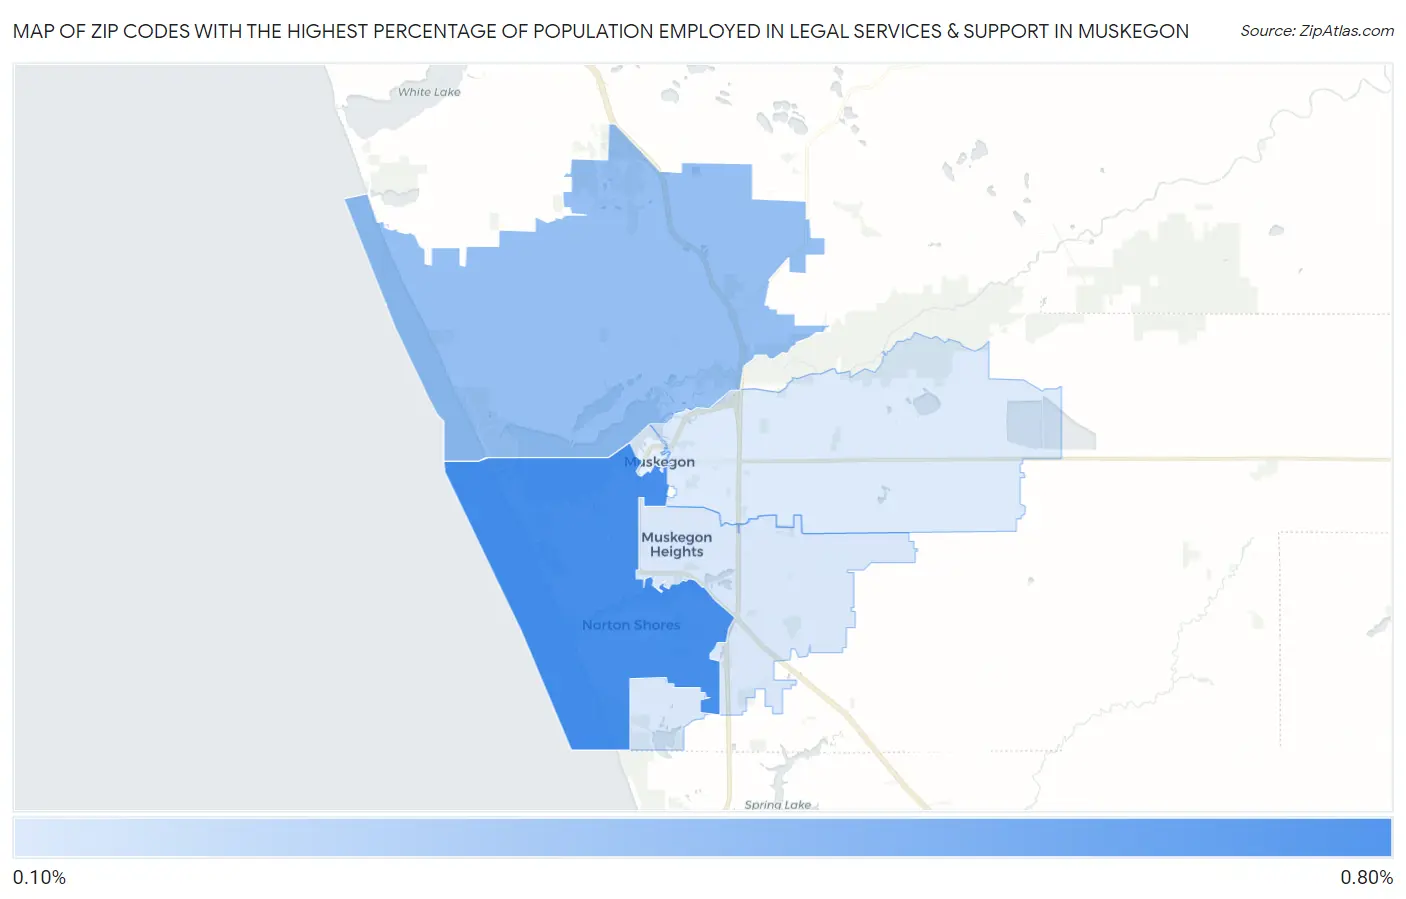
Zip Codes with the Highest Percentage of Population Employed in Legal Services & Support in Muskegon, MI
RELATED REPORTS & OPTIONS
Legal Services & Support
Muskegon
Compare Zip Codes
Map of Zip Codes with the Highest Percentage of Population Employed in Legal Services & Support in Muskegon
0.17%
0.78%
Zip Codes with the Highest Percentage of Population Employed in Legal Services & Support in Muskegon, MI
| Zip Code | % Employed | vs State | vs National | |
| 1. | 49441 | 0.78% | 0.89%(-0.102)#264 | 1.2%(-0.400)#9,614 |
| 2. | 49445 | 0.46% | 0.89%(-0.425)#402 | 1.2%(-0.724)#13,132 |
| 3. | 49444 | 0.19% | 0.89%(-0.697)#549 | 1.2%(-0.996)#16,322 |
| 4. | 49442 | 0.17% | 0.89%(-0.719)#558 | 1.2%(-1.02)#16,526 |
1
Common Questions
What are the Top 3 Zip Codes with the Highest Percentage of Population Employed in Legal Services & Support in Muskegon, MI?
Top 3 Zip Codes with the Highest Percentage of Population Employed in Legal Services & Support in Muskegon, MI are:
What zip code has the Highest Percentage of Population Employed in Legal Services & Support in Muskegon, MI?
49441 has the Highest Percentage of Population Employed in Legal Services & Support in Muskegon, MI with 0.78%.
What is the Percentage of Population Employed in Legal Services & Support in Muskegon, MI?
Percentage of Population Employed in Legal Services & Support in Muskegon is 0.52%.
What is the Percentage of Population Employed in Legal Services & Support in Michigan?
Percentage of Population Employed in Legal Services & Support in Michigan is 0.89%.
What is the Percentage of Population Employed in Legal Services & Support in the United States?
Percentage of Population Employed in Legal Services & Support in the United States is 1.2%.