Zip Codes with the Highest Percentage of Households with Income Above $200,000 in Dearborn Heights, MI
RELATED REPORTS & OPTIONS
Household Income | $200k+
Dearborn Heights
Compare Zip Codes
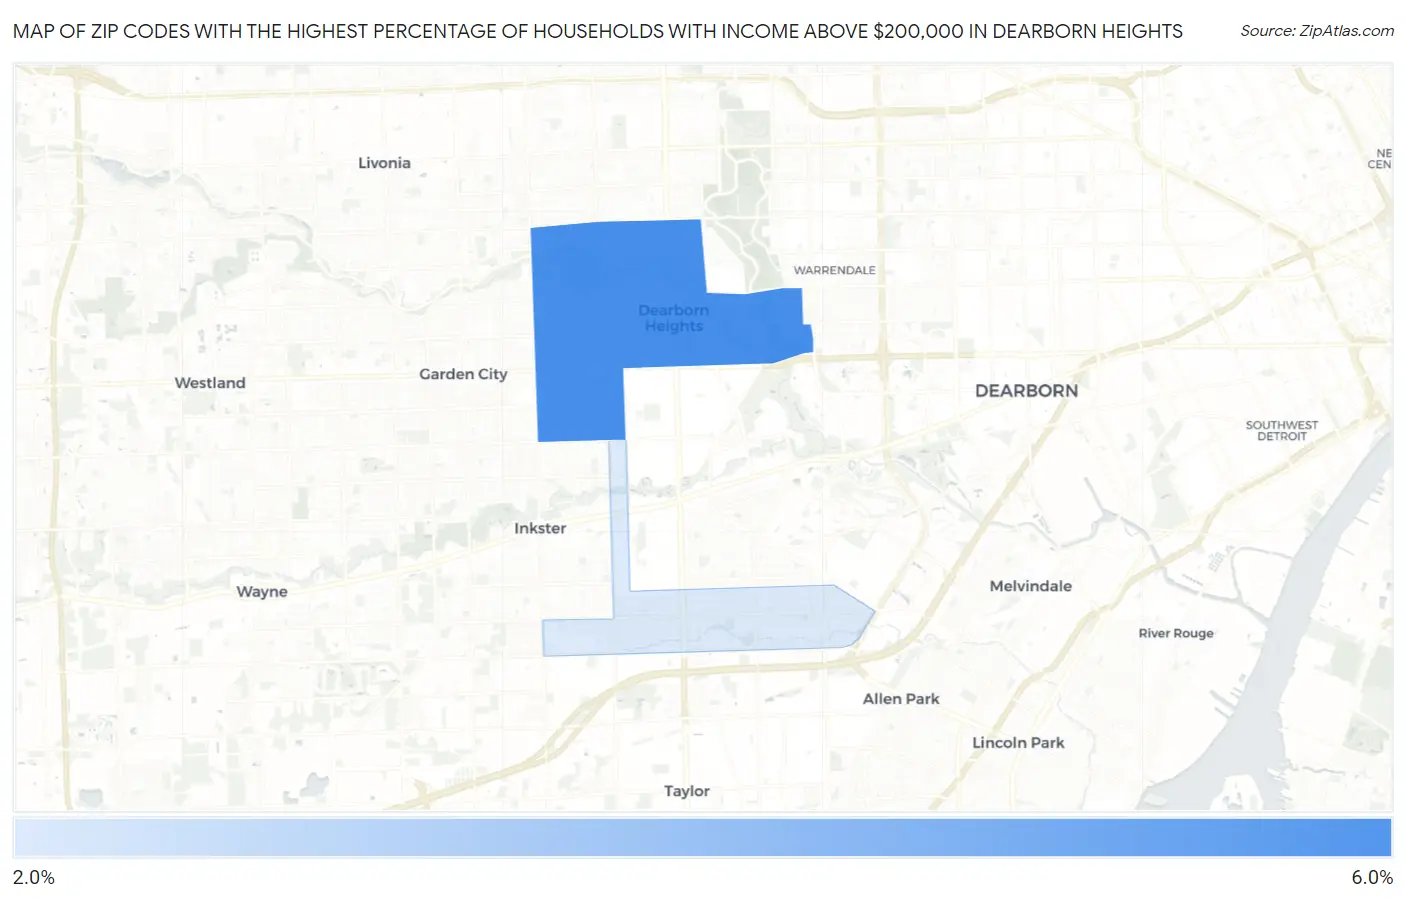
Map of Zip Codes with the Highest Percentage of Households with Income Above $200,000 in Dearborn Heights
2.0%
5.1%
Zip Codes with the Highest Percentage of Households with Income Above $200,000 in Dearborn Heights, MI
| Zip Code | Households with Income > $200k | vs State | vs National | |
| 1. | 48127 | 5.1% | 8.2%(-3.10)#388 | 11.4%(-6.30)#15,298 |
| 2. | 48125 | 2.0% | 8.2%(-6.20)#753 | 11.4%(-9.40)#23,755 |
1
Common Questions
What are the Top Zip Codes with the Highest Percentage of Households with Income Above $200,000 in Dearborn Heights, MI?
Top Zip Codes with the Highest Percentage of Households with Income Above $200,000 in Dearborn Heights, MI are:
What zip code has the Highest Percentage of Households with Income Above $200,000 in Dearborn Heights, MI?
48127 has the Highest Percentage of Households with Income Above $200,000 in Dearborn Heights, MI with 5.1%.
What is the Percentage of Households with Income Above $200,000 in Dearborn Heights, MI?
Percentage of Households with Income Above $200,000 in Dearborn Heights is 4.0%.
What is the Percentage of Households with Income Above $200,000 in Michigan?
Percentage of Households with Income Above $200,000 in Michigan is 8.2%.
What is the Percentage of Households with Income Above $200,000 in the United States?
Percentage of Households with Income Above $200,000 in the United States is 11.4%.