Zip Codes with the Highest Percentage of Families with Income Above $100,000 in Vermont
RELATED REPORTS & OPTIONS
Family Income | $100k+
Vermont
Compare Zip Codes
Map of Zip Codes with the Highest Percentage of Families with Income Above $100,000 in Vermont
40.0%
100.0%
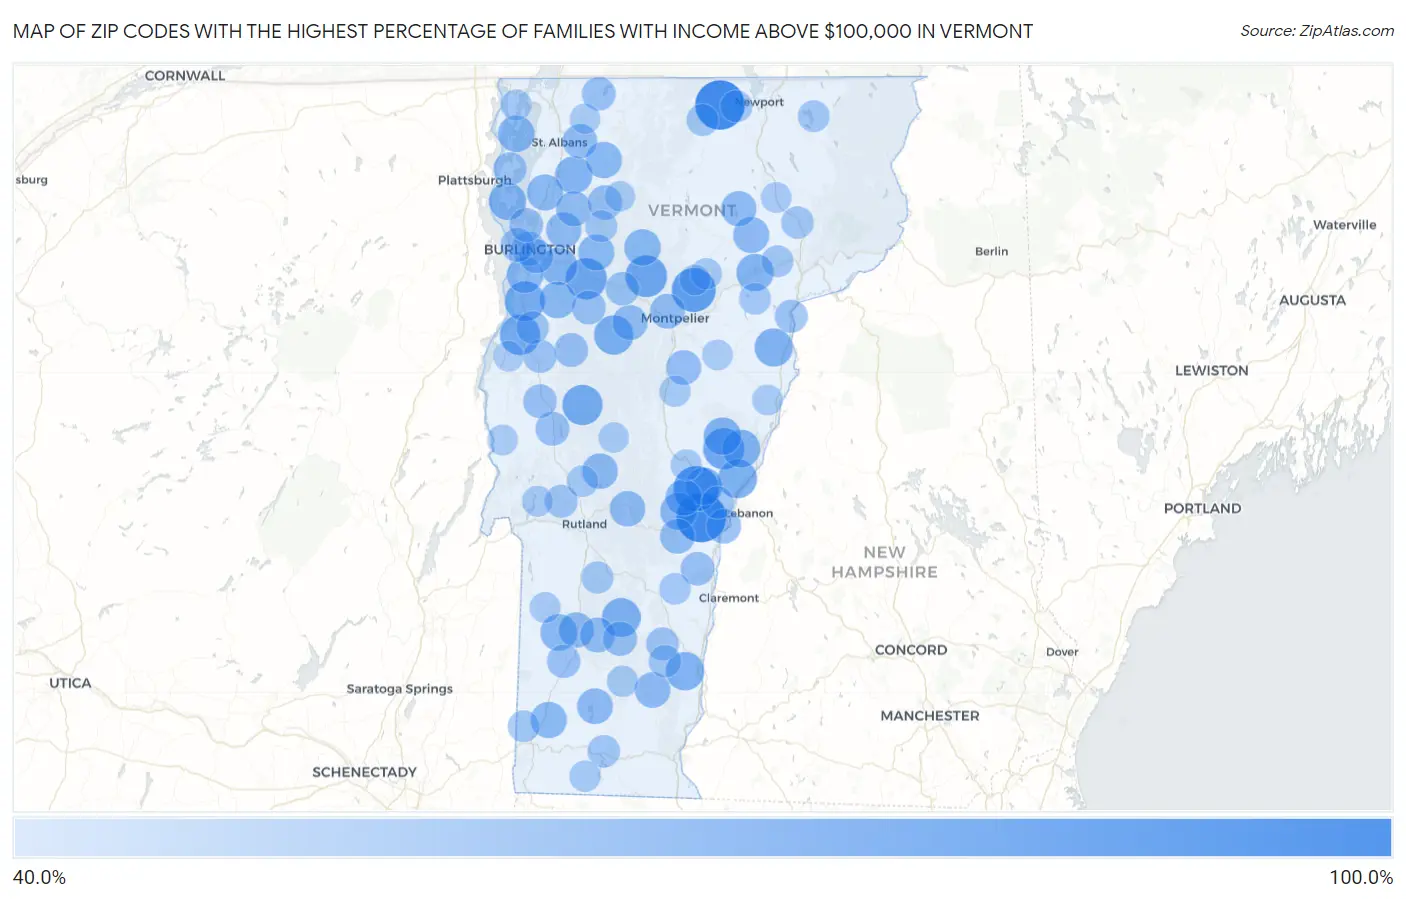
Zip Codes with the Highest Percentage of Families with Income Above $100,000 in Vermont
| Zip Code | Families with Income > $100k | vs State | vs National | |
| 1. | 05868 | 100.0% | 48.2% (+51.8)#1 | 46.1% (+53.9)#162 |
| 2. | 05073 | 100.0% | 48.2% (+51.8)#2 | 46.1% (+53.9)#244 |
| 3. | 05053 | 88.7% | 48.2% (+40.5)#3 | 46.1% (+42.6)#401 |
| 4. | 05640 | 84.5% | 48.2% (+36.3)#4 | 46.1% (+38.4)#630 |
| 5. | 05677 | 78.1% | 48.2% (+29.9)#5 | 46.1% (+32.0)#1,254 |
| 6. | 05477 | 76.8% | 48.2% (+28.6)#6 | 46.1% (+30.7)#1,439 |
| 7. | 05070 | 76.3% | 48.2% (+28.1)#7 | 46.1% (+30.2)#1,518 |
| 8. | 05456 | 74.0% | 48.2% (+25.8)#8 | 46.1% (+27.9)#1,888 |
| 9. | 05766 | 73.9% | 48.2% (+25.7)#9 | 46.1% (+27.8)#1,900 |
| 10. | 05445 | 73.7% | 48.2% (+25.5)#10 | 46.1% (+27.6)#1,930 |
| 11. | 05673 | 71.4% | 48.2% (+23.2)#11 | 46.1% (+25.3)#2,331 |
| 12. | 05055 | 70.7% | 48.2% (+22.5)#12 | 46.1% (+24.6)#2,469 |
| 13. | 05161 | 69.5% | 48.2% (+21.3)#13 | 46.1% (+23.4)#2,727 |
| 14. | 05154 | 68.6% | 48.2% (+20.4)#14 | 46.1% (+22.5)#2,907 |
| 15. | 05069 | 68.0% | 48.2% (+19.8)#15 | 46.1% (+21.9)#3,025 |
| 16. | 05075 | 67.2% | 48.2% (+19.0)#16 | 46.1% (+21.1)#3,210 |
| 17. | 05072 | 66.5% | 48.2% (+18.3)#17 | 46.1% (+20.4)#3,380 |
| 18. | 05084 | 66.0% | 48.2% (+17.8)#18 | 46.1% (+19.9)#3,510 |
| 19. | 05495 | 65.8% | 48.2% (+17.6)#19 | 46.1% (+19.7)#3,542 |
| 20. | 05454 | 65.7% | 48.2% (+17.5)#20 | 46.1% (+19.6)#3,559 |
| 21. | 05486 | 65.7% | 48.2% (+17.5)#21 | 46.1% (+19.6)#3,562 |
| 22. | 05873 | 65.7% | 48.2% (+17.5)#22 | 46.1% (+19.6)#3,565 |
| 23. | 05091 | 65.0% | 48.2% (+16.8)#23 | 46.1% (+18.9)#3,750 |
| 24. | 05251 | 64.0% | 48.2% (+15.8)#24 | 46.1% (+17.9)#4,014 |
| 25. | 05461 | 63.9% | 48.2% (+15.7)#25 | 46.1% (+17.8)#4,043 |
| 26. | 05474 | 63.9% | 48.2% (+15.7)#26 | 46.1% (+17.8)#4,049 |
| 27. | 05672 | 63.6% | 48.2% (+15.4)#27 | 46.1% (+17.5)#4,123 |
| 28. | 05067 | 63.2% | 48.2% (+15.0)#28 | 46.1% (+17.1)#4,241 |
| 29. | 05482 | 62.9% | 48.2% (+14.7)#29 | 46.1% (+16.8)#4,310 |
| 30. | 05262 | 62.8% | 48.2% (+14.6)#30 | 46.1% (+16.7)#4,339 |
| 31. | 05448 | 62.8% | 48.2% (+14.6)#31 | 46.1% (+16.7)#4,343 |
| 32. | 05468 | 62.6% | 48.2% (+14.4)#32 | 46.1% (+16.5)#4,385 |
| 33. | 05465 | 62.6% | 48.2% (+14.4)#33 | 46.1% (+16.5)#4,391 |
| 34. | 05836 | 62.1% | 48.2% (+13.9)#34 | 46.1% (+16.0)#4,532 |
| 35. | 05360 | 61.4% | 48.2% (+13.2)#35 | 46.1% (+15.3)#4,732 |
| 36. | 05737 | 61.3% | 48.2% (+13.1)#36 | 46.1% (+15.2)#4,771 |
| 37. | 05353 | 61.1% | 48.2% (+12.9)#37 | 46.1% (+15.0)#4,835 |
| 38. | 05751 | 60.8% | 48.2% (+12.6)#38 | 46.1% (+14.7)#4,924 |
| 39. | 05452 | 60.6% | 48.2% (+12.4)#39 | 46.1% (+14.5)#4,969 |
| 40. | 05253 | 60.2% | 48.2% (+12.0)#40 | 46.1% (+14.1)#5,082 |
| 41. | 05841 | 60.2% | 48.2% (+12.0)#41 | 46.1% (+14.1)#5,085 |
| 42. | 05494 | 60.0% | 48.2% (+11.8)#42 | 46.1% (+13.9)#5,132 |
| 43. | 05660 | 59.6% | 48.2% (+11.4)#43 | 46.1% (+13.5)#5,275 |
| 44. | 05071 | 59.4% | 48.2% (+11.2)#44 | 46.1% (+13.3)#5,338 |
| 45. | 05152 | 59.3% | 48.2% (+11.1)#45 | 46.1% (+13.2)#5,370 |
| 46. | 05602 | 59.1% | 48.2% (+10.9)#46 | 46.1% (+13.0)#5,419 |
| 47. | 05679 | 58.7% | 48.2% (+10.5)#47 | 46.1% (+12.6)#5,560 |
| 48. | 05052 | 58.4% | 48.2% (+10.2)#48 | 46.1% (+12.3)#5,663 |
| 49. | 05455 | 58.2% | 48.2% (+10.0)#49 | 46.1% (+12.1)#5,719 |
| 50. | 05444 | 57.9% | 48.2% (+9.70)#50 | 46.1% (+11.8)#5,816 |
| 51. | 05148 | 57.4% | 48.2% (+9.20)#51 | 46.1% (+11.3)#5,992 |
| 52. | 05401 | 57.0% | 48.2% (+8.80)#52 | 46.1% (+10.9)#6,097 |
| 53. | 05403 | 57.0% | 48.2% (+8.80)#53 | 46.1% (+10.9)#6,102 |
| 54. | 05408 | 56.2% | 48.2% (+8.00)#54 | 46.1% (+10.1)#6,370 |
| 55. | 05443 | 56.2% | 48.2% (+8.00)#55 | 46.1% (+10.1)#6,372 |
| 56. | 05462 | 56.2% | 48.2% (+8.00)#56 | 46.1% (+10.1)#6,376 |
| 57. | 05769 | 56.2% | 48.2% (+8.00)#57 | 46.1% (+10.1)#6,379 |
| 58. | 05446 | 56.1% | 48.2% (+7.90)#58 | 46.1% (+10.0)#6,405 |
| 59. | 05753 | 55.9% | 48.2% (+7.70)#59 | 46.1% (+9.80)#6,479 |
| 60. | 05037 | 55.9% | 48.2% (+7.70)#60 | 46.1% (+9.80)#6,495 |
| 61. | 05457 | 55.8% | 48.2% (+7.60)#61 | 46.1% (+9.70)#6,524 |
| 62. | 05676 | 55.3% | 48.2% (+7.10)#62 | 46.1% (+9.20)#6,702 |
| 63. | 05255 | 55.1% | 48.2% (+6.90)#63 | 46.1% (+9.00)#6,779 |
| 64. | 05472 | 54.6% | 48.2% (+6.40)#64 | 46.1% (+8.50)#6,955 |
| 65. | 05458 | 54.2% | 48.2% (+6.00)#65 | 46.1% (+8.10)#7,110 |
| 66. | 05050 | 53.8% | 48.2% (+5.60)#66 | 46.1% (+7.70)#7,260 |
| 67. | 05143 | 53.6% | 48.2% (+5.40)#67 | 46.1% (+7.50)#7,317 |
| 68. | 05744 | 53.6% | 48.2% (+5.40)#68 | 46.1% (+7.50)#7,334 |
| 69. | 05473 | 52.8% | 48.2% (+4.60)#69 | 46.1% (+6.70)#7,639 |
| 70. | 05363 | 52.6% | 48.2% (+4.40)#70 | 46.1% (+6.50)#7,719 |
| 71. | 05146 | 52.6% | 48.2% (+4.40)#71 | 46.1% (+6.50)#7,728 |
| 72. | 05001 | 52.4% | 48.2% (+4.20)#72 | 46.1% (+6.30)#7,805 |
| 73. | 05850 | 52.4% | 48.2% (+4.20)#73 | 46.1% (+6.30)#7,828 |
| 74. | 05742 | 51.4% | 48.2% (+3.20)#74 | 46.1% (+5.30)#8,262 |
| 75. | 05857 | 51.2% | 48.2% (+3.00)#75 | 46.1% (+5.10)#8,343 |
| 76. | 05874 | 51.2% | 48.2% (+3.00)#76 | 46.1% (+5.10)#8,347 |
| 77. | 05489 | 51.0% | 48.2% (+2.80)#77 | 46.1% (+4.90)#8,420 |
| 78. | 05853 | 50.7% | 48.2% (+2.50)#78 | 46.1% (+4.60)#8,550 |
| 79. | 05257 | 50.6% | 48.2% (+2.40)#79 | 46.1% (+4.50)#8,582 |
| 80. | 05828 | 50.6% | 48.2% (+2.40)#80 | 46.1% (+4.50)#8,584 |
| 81. | 05862 | 50.5% | 48.2% (+2.30)#81 | 46.1% (+4.40)#8,643 |
| 82. | 05142 | 50.0% | 48.2% (+1.80)#82 | 46.1% (+3.90)#8,832 |
| 83. | 05763 | 49.8% | 48.2% (+1.60)#83 | 46.1% (+3.70)#8,956 |
| 84. | 05068 | 49.3% | 48.2% (+1.10)#84 | 46.1% (+3.20)#9,165 |
| 85. | 05036 | 49.2% | 48.2% (+1.00)#85 | 46.1% (+3.10)#9,210 |
| 86. | 05650 | 49.2% | 48.2% (+1.00)#86 | 46.1% (+3.10)#9,211 |
| 87. | 05350 | 49.1% | 48.2% (+0.900)#87 | 46.1% (+3.00)#9,246 |
| 88. | 05343 | 48.6% | 48.2% (+0.400)#88 | 46.1% (+2.50)#9,484 |
| 89. | 05440 | 48.5% | 48.2% (+0.300)#89 | 46.1% (+2.40)#9,528 |
| 90. | 05761 | 48.2% | 48.2% (=0.000)#90 | 46.1% (+2.10)#9,670 |
| 91. | 05732 | 48.1% | 48.2% (-0.100)#91 | 46.1% (+2.00)#9,714 |
| 92. | 05770 | 47.9% | 48.2% (-0.300)#92 | 46.1% (+1.80)#9,831 |
| 93. | 05033 | 47.7% | 48.2% (-0.500)#93 | 46.1% (+1.60)#9,923 |
| 94. | 05648 | 47.7% | 48.2% (-0.500)#94 | 46.1% (+1.60)#9,940 |
| 95. | 05649 | 47.6% | 48.2% (-0.600)#95 | 46.1% (+1.50)#10,009 |
| 96. | 05866 | 47.5% | 48.2% (-0.700)#96 | 46.1% (+1.40)#10,057 |
| 97. | 05491 | 47.3% | 48.2% (-0.900)#97 | 46.1% (+1.20)#10,144 |
| 98. | 05483 | 47.1% | 48.2% (-1.10)#98 | 46.1% (+1.00)#10,263 |
| 99. | 05767 | 47.1% | 48.2% (-1.10)#99 | 46.1% (+1.00)#10,267 |
| 100. | 05464 | 46.8% | 48.2% (-1.40)#100 | 46.1% (+0.700)#10,410 |
Common Questions
What are the Top 10 Zip Codes with the Highest Percentage of Families with Income Above $100,000 in Vermont?
Top 10 Zip Codes with the Highest Percentage of Families with Income Above $100,000 in Vermont are:
What zip code has the Highest Percentage of Families with Income Above $100,000 in Vermont?
05868 has the Highest Percentage of Families with Income Above $100,000 in Vermont with 100.0%.
What is the Percentage of Families with Income Above $100,000 in the State of Vermont?
Percentage of Families with Income Above $100,000 in Vermont is 48.2%.
What is the Percentage of Families with Income Above $100,000 in the United States?
Percentage of Families with Income Above $100,000 in the United States is 46.1%.